Dashboard
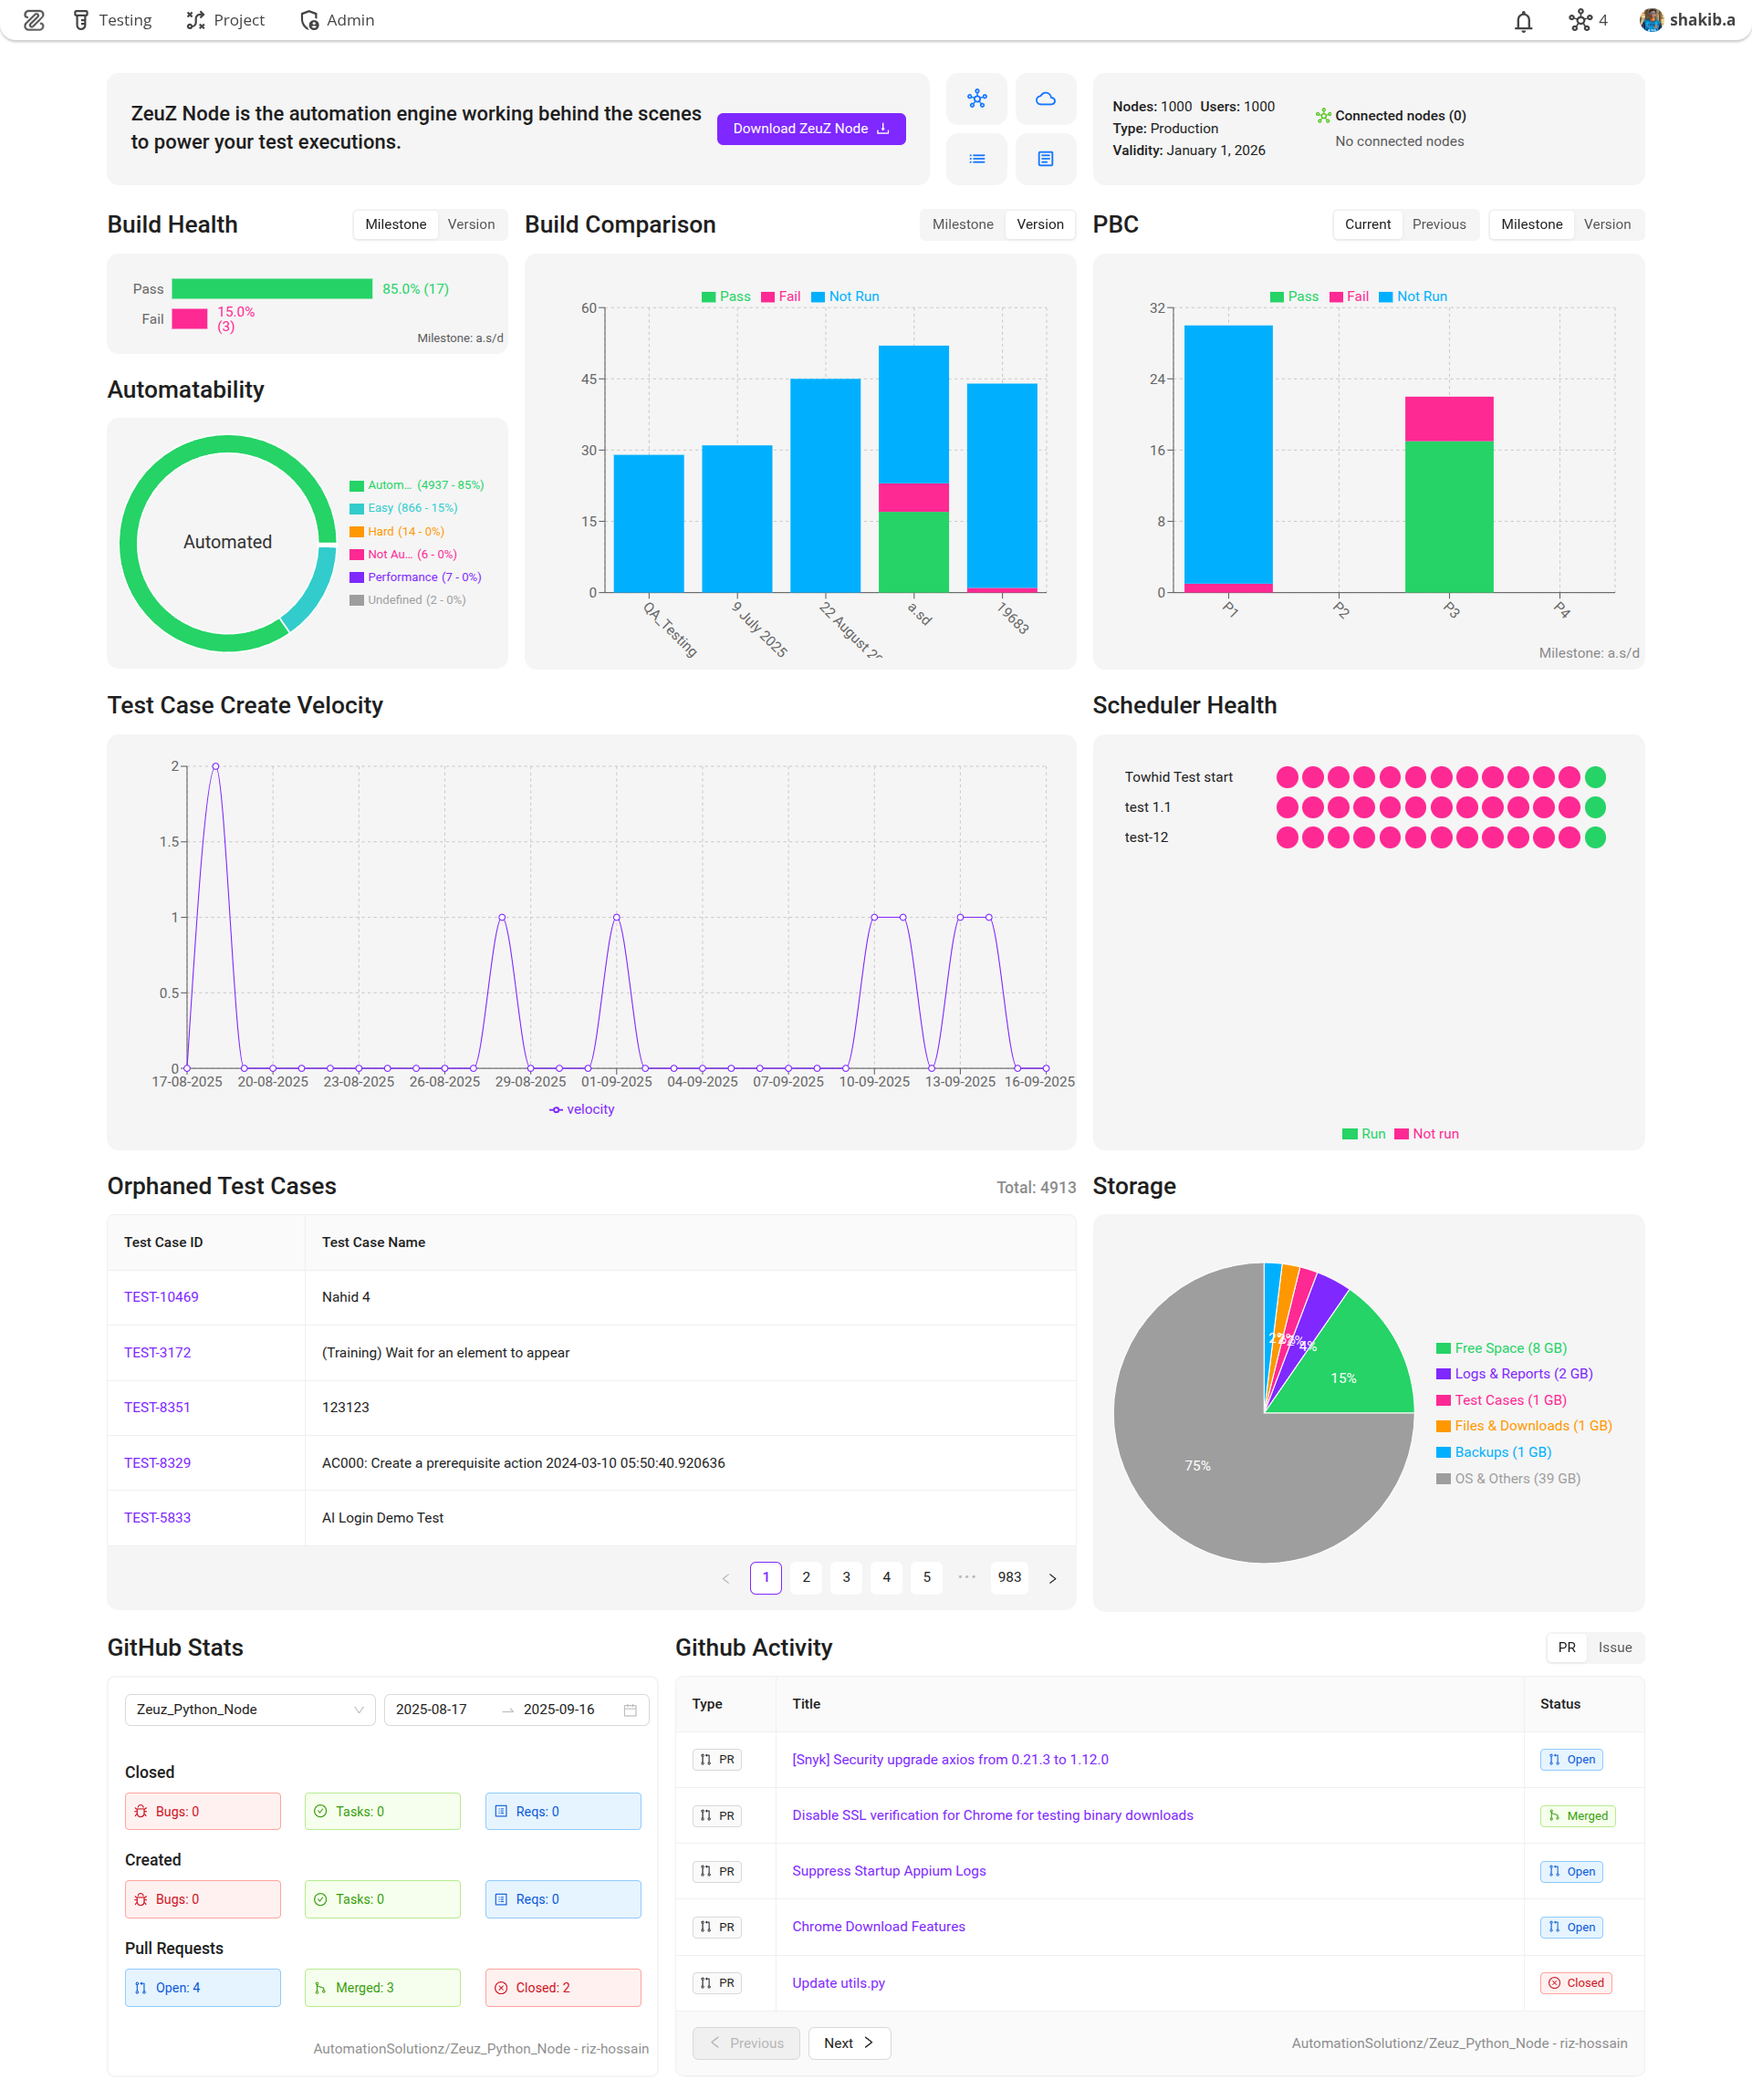
The ZeuZ dashboard is the main overview screen that gives you a quick look at your projects, tests, and overall system health. It provides key metrics, summaries, and information to help you understand what's happening at a glance.
Why it matters / Use Cases:
- You immediately see if your automation infrastructure is alive: how many nodes are connected, license validity. If a node drops you don’t have to wait for manual reports.
- You catch quality shifts fast - “Build Health” and “Build Comparison” show at a glance whether a recent build broke things or got better.
- Prioritization becomes clear: failures in high priority (P1, P2) tests are highlighted, so you can focus on the biggest risks first.
- You see how much of your tests are automatable vs hard vs not automatable. That helps you plan: where to invest automation efforts.
- You can track momentum: how many test cases are being created daily - good for spotting slowdowns in coverage expansion.
- Scheduler status tells you if scheduled runs are failing so you don’t have “blind spots” in your test suite.
- Storage & orphaned test cases sections help maintain hygiene: clean up drift in test catalog & avoid wasted space or legacy cruft.
- GitHub integration gives traceability: link PR activity & issues with test results, good for debugging why things broke.
Prerequisites
- The dashboard doesn’t require any setup. However, to get the most out of it, we recommend maintaining milestones and integrating GitHub.
Features
ZeuZ Node Area
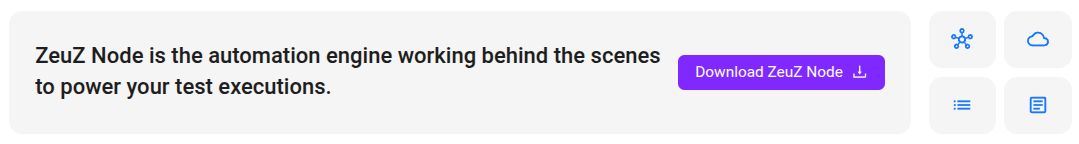
1. ZeuZ Node Description Box
- Text: "ZeuZ Node is the automation engine working behind the scenes to power your test executions".
- This means the ZeuZ Node is responsible for executing automated tests locally or on remote systems.
2. Download Button
- Labelled "Download ZeuZ Node", this button allows users to download the node installer or package.
3. Navigation Tiles
- Node: Node setup and usage.
- Server: Server configuration and monitoring.
- Changelog: Shows version updates and improvements.
- Docs: Opens the full documentation for user guidance.
License and Node Information
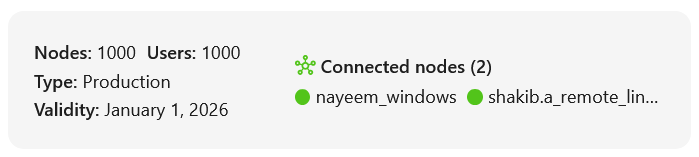
The node section has been added to display the license information. It also shows the list of currently connected nodes. This section will become scrollable if there are more than four connected nodes.
Here is a summary of the details:
General Information
- Nodes: 1000
Indicates that the environment is licensed to support upto *1000 execution nodes. - Users: 1000
Allows upto 1000 users to access the system. - Type: Production
Specifies that this instance is intended for production use, not for testing or development purposes. - Validity: January 1, 2026
The license remains valid until January 1, 2026.
Connected Nodes
- The system currently shows two connected nodes, meaning two machines are actively communicating with the ZeuZ platform.
The connected nodes are:
- nayeem_windows: (remote windows node for test execution).
- shakib.a_remote_linux: (remote linux node for test execution).
Build Health
Build Health refers to the overall quality and stability of a software build, as determined by the results of automated or manual test cases executed during the build process. It is basically a chart showing the pass and fail status of the current build.
There are two tabs at the top:
1. Milestone: This suggests that the build health can be viewed in the context of specific milestones (e.g., stages or goals in a project).
2. Version: This suggests that the build health can also be viewed in the context of specific versions (e.g., releases or iterations of the software).
Build Health displays two key metrics, such as:
1. Pass: Indicates the percentage of tests or checks that passed successfully.
2. Fail: Indicates the percentage of tests or checks that failed.
However, in the Build Health section, without requiring any hover action, it will now show percentage values beside the metrics, for example, test results: 94.3% Passed (33) and 5.7% Failed (2). These insights will be visible directly, without the need to hover. Additionally, the selected Milestone or Version will be displayed below the build health summary.
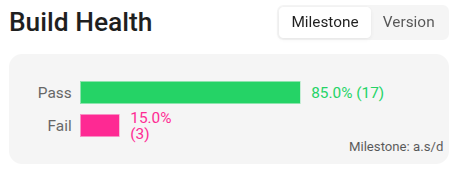
In the Build Health section, if no data is available, it will display as zero.
Automatability
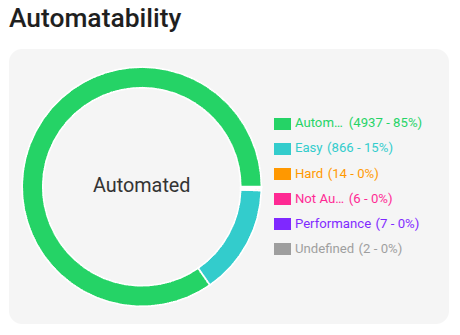
Automatability refers to how easily and effectively a test can be automated using automation tools or frameworks. In this context, the chart shown is a Donut chart, which is commonly used to represent proportions or distributions. The chart is divided into segments, each representing a different category of automatability.
Automatability Categories
| Category | Color |
|---|---|
| Automated | Green |
| Easily Automated | Cyan |
| Hard to Automate | Orange |
| Not Automatable | Hot Pink |
| Performance | Purple |
| Undefined | Gray |
Under our server, test cases are categorized based on their level of automatability. In the Automatability section, users can now view the total number of test cases and see what percentage of them are "Automated", "Easily Automatable", or "Hard to Automate", etc., without the need to hover. For example, there are:
- 4937 automated test cases (85%),
- 866 test cases that are easily automatable (15%),
- 14 test cases that are hard to automate (0%),
- 6 test cases that are not automatable (0%),
- 7 test cases that are under performance (0%),
- 2 undefined test cases (0%).
Build Comparison
Build Comparison refers to the process of comparing the test results of two or more software builds to identify changes in quality, functionality, or performance overtime.
This chart displays a comparison of the last five builds. It shows how many test cases were not run or passed in previous versions or milestones, and how many have passed in recent builds, etc. The purpose is to provide a clear comparison.
In the Build Comparison section, the blocks have now been merged as follows:
- The Fail block now combines both "Fail" and "Block" status.
- The Not Run block now combines both "Skip" and "Submit" status.
However, this helps determine whether the quality is improving or degrading overtime.
At the top, there are toggle options for Milestone and Version. When Milestone is selected, the build comparison is shown based on milestones. When Version is selected, the build comparison is shown based on version.
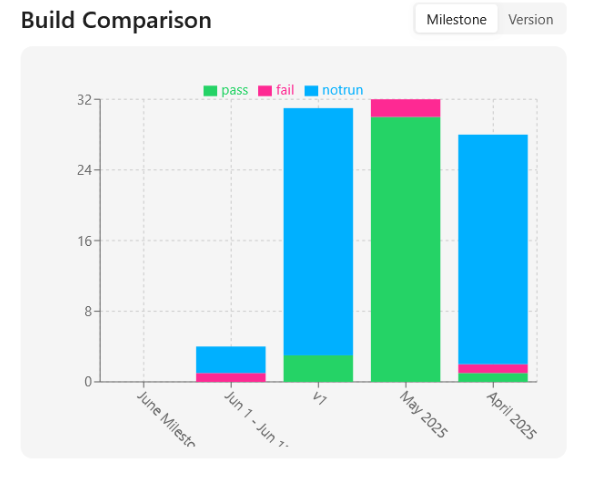
Here, the June milestone is the current build, while the others are previous builds.
PBC (Priority Based Comparison)
Priority Based Comparison refers to the process of comparing test results based on the priority levels assigned to test cases. It allows users to analyze test results based on different priority levels, such as P1, P2, P3 and P4.
In case of PBC (Priority Based Comparison), when the Current, Previous, Milestone or Version is selected, the selected Current / Previous Milestone or Current / Previous Version will be displayed below the PBC section. Additionally, as before, the Fail status includes both failed and blocked test cases, and the Not Run status includes both "Skipped" and "Submitted" test cases.
The following image displays a tooltip or data breakdown for a test priority category labeled P1. It shows the execution status of test cases under this priority:
- Pass: 30
A total of thirty test cases have passed. - Fail: 2
Two test cases have failed. - Not Run: 3
Three test cases have not been executed.
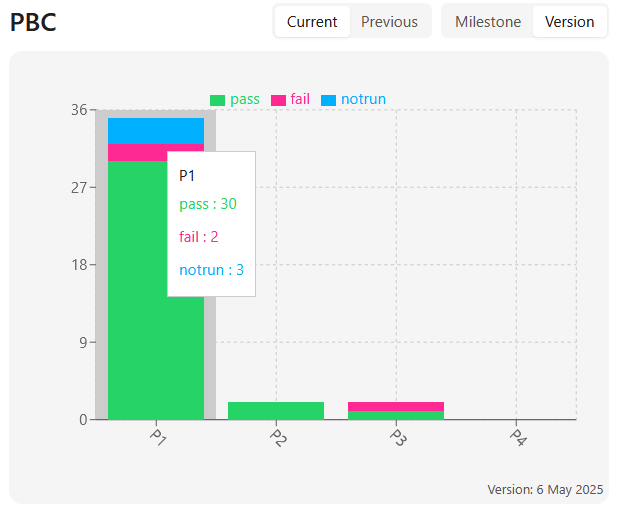
The chart also displays the number of test cases that are passing, failing, and not running within each priority level. Additionally, hovering over the Current label reveals the name of the most recent build, and this comparison can be used across milestones or versions to track how test cases are performing based on their assigned priorities.
Test Case Create Velocity
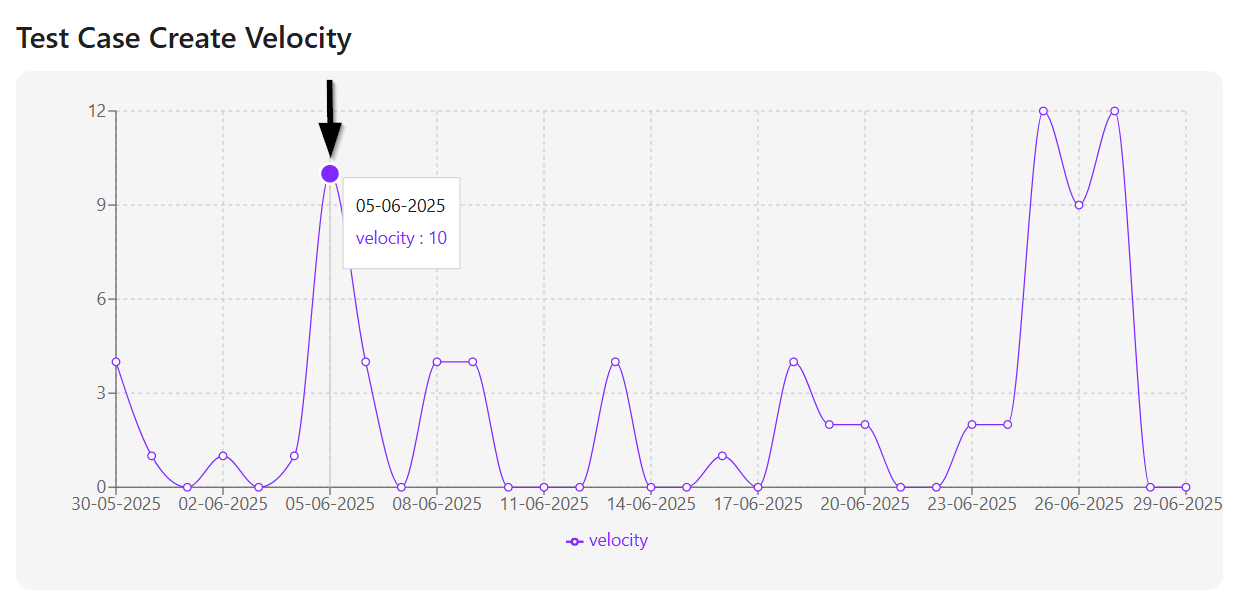
Test Case Create Velocity refers to the rate at which test cases are being created over a defined period of time. It mainly shows the number of test cases created each day over the past 30 days. It helps to understand the number of test cases on specific dates, providing a date-wise breakdown of test case creation activity.
Scheduler Health
Scheduler Health refers to the current status of the schedulers in an automation system.
In the Scheduler Health section, the name of each scheduler will be displayed on the left side. Under each scheduler, the number of test runs and the number of tests not run will be shown.
If a scheduler shows a hot pink sign, it means that the test did not run.
If a scheduler shows a green sign, it means the test was successfully executed.

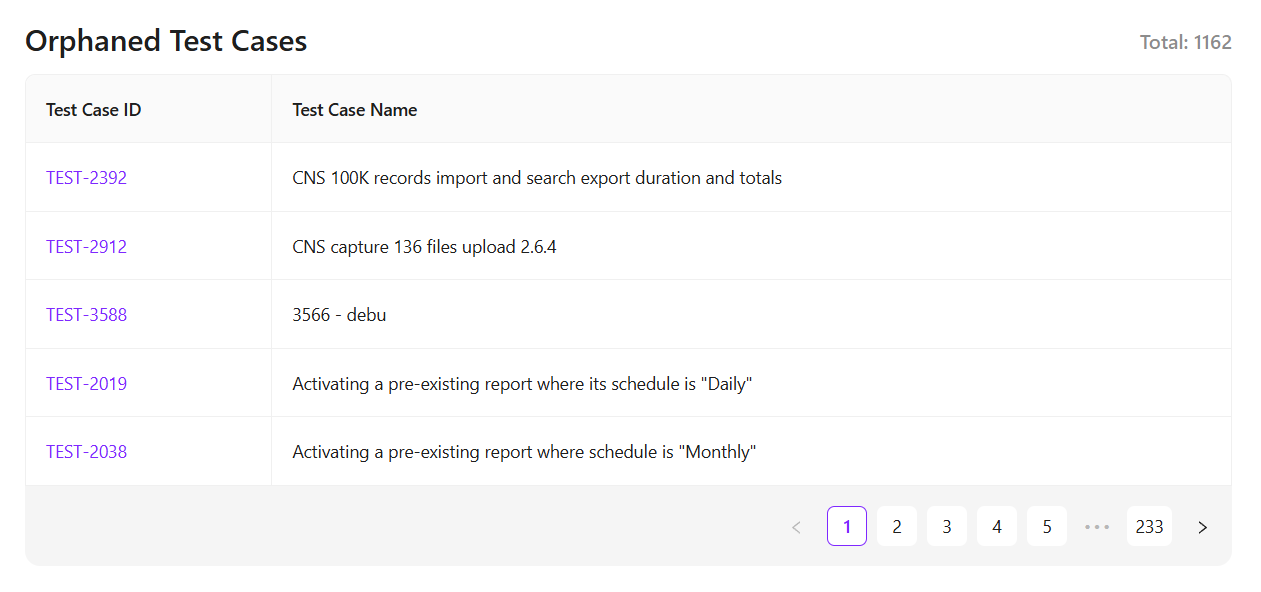
Orphaned Test Cases
Orphaned Test Cases are test cases that are no longer linked to any active or valid test set. They exist in the system but are not part of any current testing activity or structure.
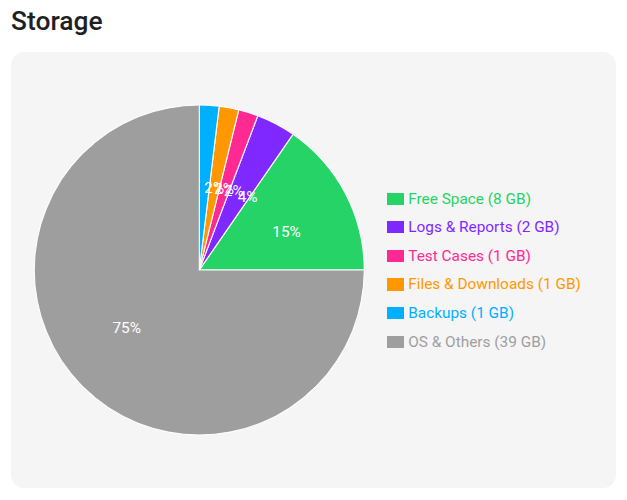
Storage
The Storage section has been upgraded. It now displays a visual design on the right side, along with detailed information showing how much space each item is using. For example:
- Free Space (8 GB)
- Logs & Reports (2 GB)
- Test Cases (1 GB)
- Files & Downloads (1 GB)
- Backups (1 GB)
- OS & Others (39 GB).
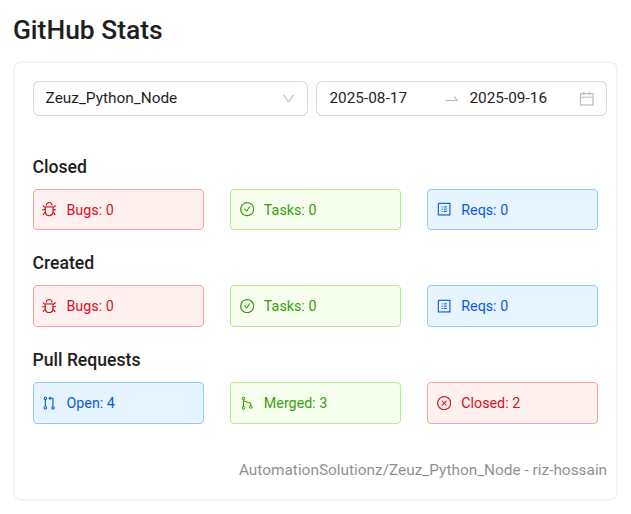
GitHub Stats and GitHub Activity
- The Dashboard will display GitHub Stats and GitHub Activity for the selected repositories.
- By default, the first selected repository is displayed.
- Multiple repositories can be displayed depending on the selection during integration.
- A Start Date and End Date can be applied to filter the displayed data.
- The displayed information includes the count of Closed Bugs, Tasks, and Requirements within the selected date range, followed by the count Created Bugs, Tasks, and Requirements for the same date range.
- The number of Open, Merged, and Closed pull requests will be displayed under the Pull Request section.
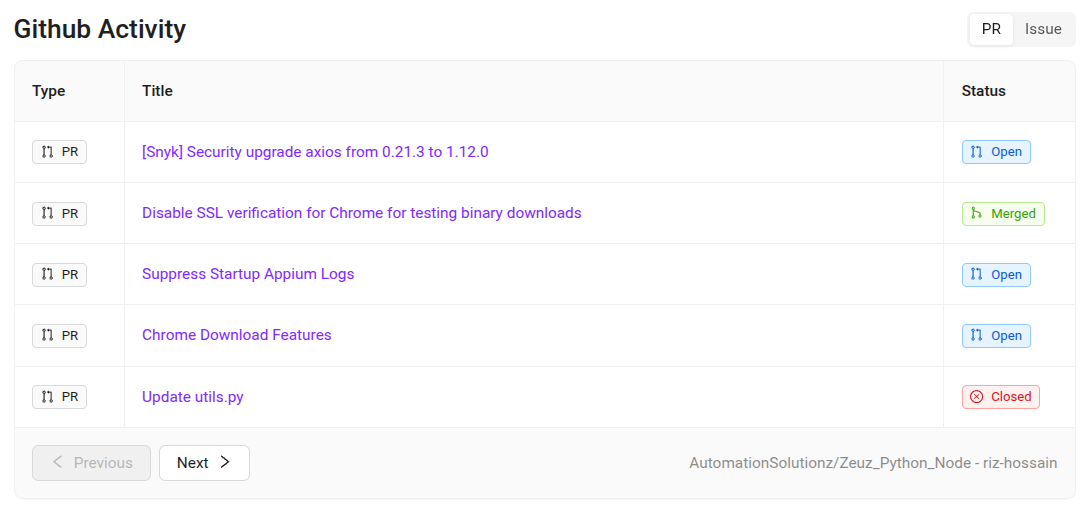
- On the other hand, the table can be filtered by Pull Requests or Issues within the selected date range:
- Issues can be Open or Closed.
- Pull Requests can be Open, Merged, or Closed.
- Users can click on any Pull Request or Issue to navigate to it in GitHub. Pagination is available to view additional data if more entries are available.
FAQs / Troubleshooting
FAQs
What information can I view on the dashboard?
The dashboard provides an overview of builds, test cases, scheduler health, storage usage, and linked integrations such as GitHub or Jira.
How often does the dashboard data refresh?
The dashboard updates automatically at set intervals, but users can also refresh it manually.
Can I filter dashboard data by project or date range?
Yes, filters are available to narrow down information by project, team, or specific date ranges.
Does the dashboard show real-time execution results?
Yes, the dashboard reflects live updates from ongoing test executions.
Troubleshooting
- Dashboard is not loading properly → Clear browser cache or try logging out and back in.
- Widgets are missing → Check user permissions or reconfigure dashboard settings.
- Graphs or metrics showing incorrect data → Confirm that filters (date, project, team) are applied correctly.
- Integration data (GitHub/Jira) not appearing → Ensure proper integration setup and authentication.
Changelog
- New UI introduced [20250712]