Execution
An Execution Report in software testing is a concise document that summarizes the testing process and outcomes. It includes details of test cases, their status (pass/fail), observed results, test environment information, metrics like coverage and execution time, recorded defects or issues, and overall recommendations. The report provides stakeholders with a clear understanding of testing progress, highlights the quality of the software, and assists in decision-making regarding the readiness for release.
Why it matters / Use Cases:
- Progress Tracking: Monitor the completion rate of test cases within a plan or milestone.
- Quality Assesment: Evaluate software stability by analyzing test results marked as Passed, Failed, Blocked, Submitted, In Progress, Skipped, or Not Run.
- Defect Identification: Detect recurring issues and trace failures to specific modules or builds.
- Team Evaluation: Measure tester performance and workload distribution.
- Audit and Compliance: Maintain a record of executed tests for audits or client reporting.
- Continuous Improvement: Identify weak areas in testing or development for process enhancement.
- Release Readiness: Determine whether the product meets quality standards before deployment.
Prerequisites
- Access to ZeuZ Server with permissions for Testing → Reports → Execution.
- Test cases must have been executed at least once to generate report data.
- The execution should be linked to a milestone or version for organized tracking.
- Ensure all test statuses (Passed, Failed, Blocked, etc.) are properly updated before generating the report.
Quick-Start
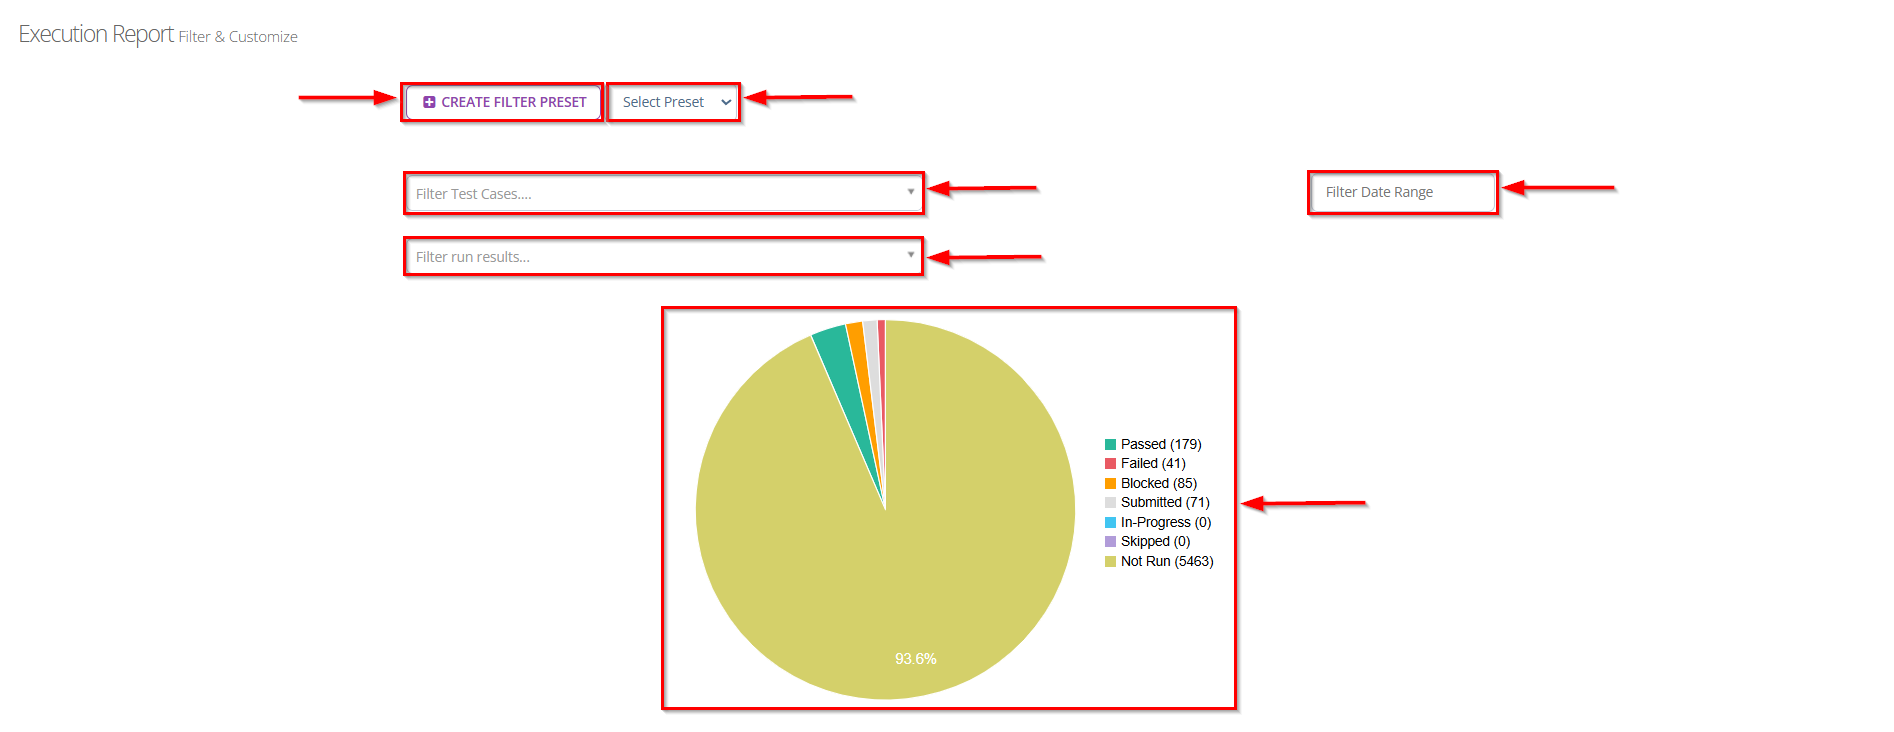
- Click Create Filter Preset or select an existing preset from the dropdown to quickly apply predefined filters.
- Use the Filter Test Cases dropdown to select specific test cases you want to include in the report. However, multiple of test cases can also be selected.
- Use the Filter Run Results dropdown to filter by test status such as Passed, Failed, Blocked, Submitted, In-Progress, Skipped, or Not Run. However, multiple of run results can also be selected.
- Set a Date range to narrow the report to a specific execution period.
- The report will display as a Pie Chart, showing the count and percentage of each test status for the selected filters.
Features
Test Case Details
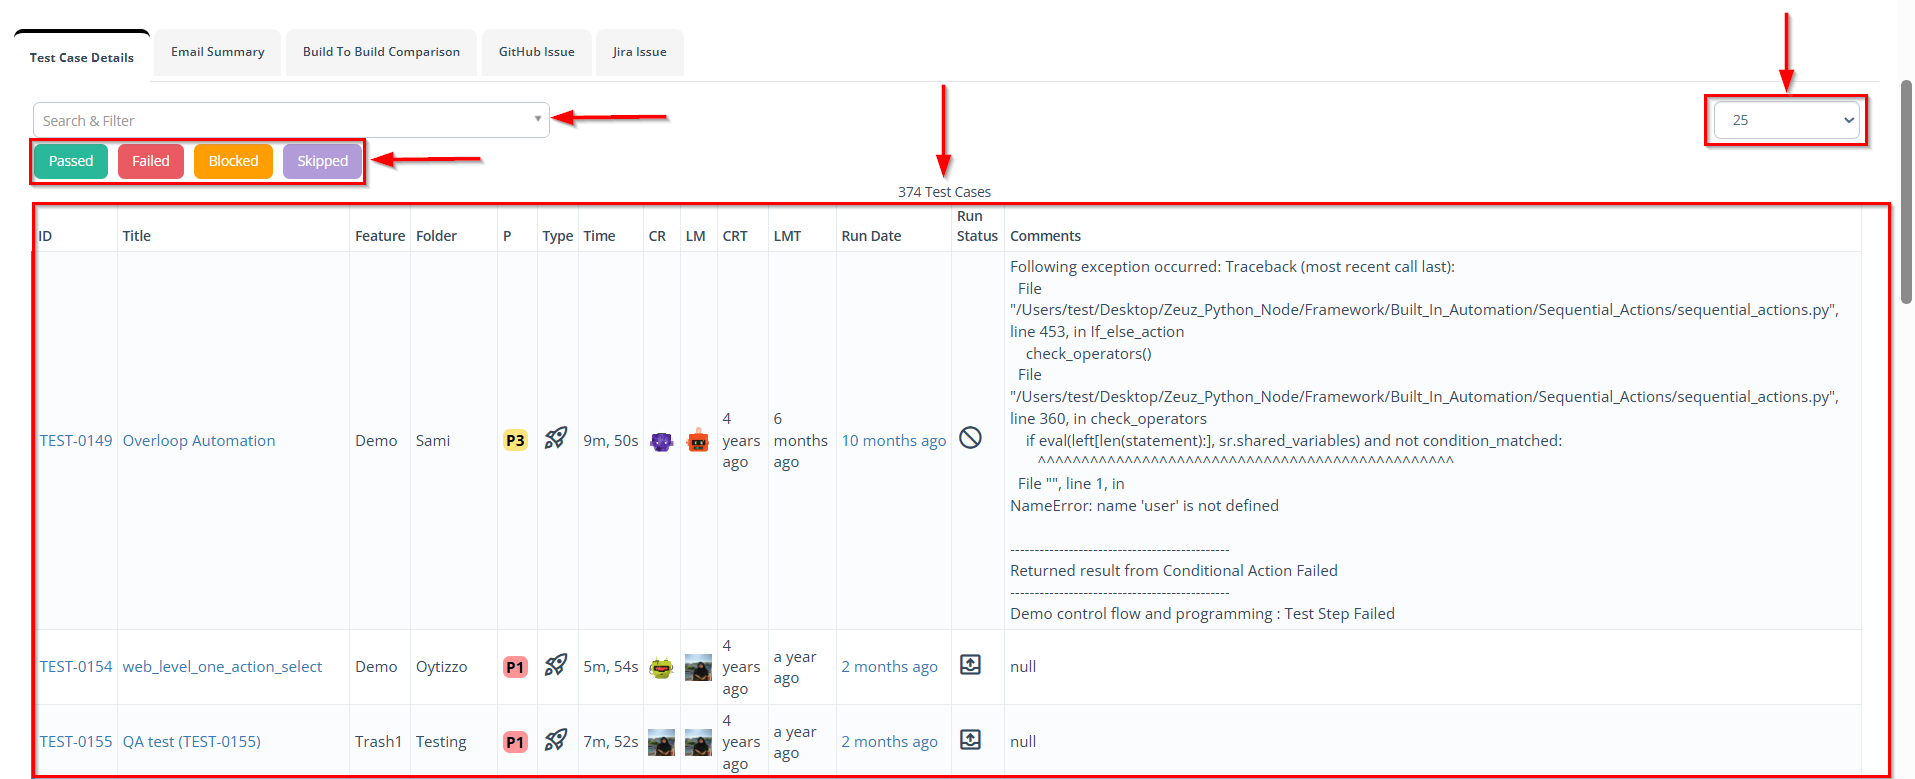
- Search and Filter: The search bar and filter dropdown allow the tester to find specific test cases by keyword, ID, folder, feature, or other criteria.
- Status Filter Buttons: Buttons labeled Passed, Failed, Blocked, and Skipped allow users to quickly filter and view test cases based on their execution status.
- Test Case Count: The total number of test cases displayed (e.g., "374 Test Cases") helps users understand the overall execution volume.
- Pagination Option: The dropdown on the right (e.g., "25") allows users to select how many test cases to display per page for easier navigation.
- Table Columns:
- Identifiers and Metadata: The leftmost columns include ID and Title. These identify each test case and provide a direct link to the test case details.
- Organization: Columns such as Feature and Folder show where the test case belongs in the project structure. This helps with traceability.
- Priority and Type: The P (Priority) and Type columns indicate test importance and category (for example, "P1/P3 or automation vs. manual").
- Execution Metrics: Columns like Time, CR (Created), LM (Last Modified), CRT and LMT (Creation/Last Modified Timestamps) provide execution duration and history for each test case.
- Run Date and Run Status: These columns show when the test case was last executed and the final run status (Passed, Failed, Blocked, etc.). The run-status icon explains quick state at a glance.
- Comments Section (Right Side): For failed or blocked test cases, detailed execution logs or error messages appear. In this example, a "NameError" occured in the Python automation script, helping testers identify and debug issues quickly.
Email Summary
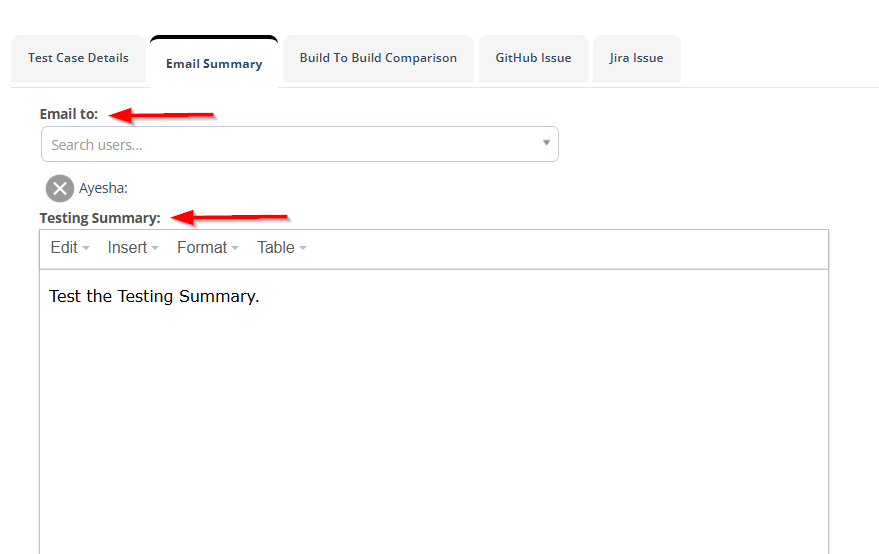
- The Email to field indicates you are preparing to send an email to specific recipents.
- The Search users function allows you to to find and select specific users from the system to receive this email. This suggests the email will be sent to team members or stakeholders within the organization.
- The Testing Summary typically includes detailed reports on testing activities, results, and progress metrics.
- The toolbar provides formatting options:
- Edit: Basic editing functions.
- Insert: Add elements like image, link, media, or horizontal line.
- Format: Text formatting options (Bold, Italic, Underline, Strikethrough, Superscript, Subscript etc.).
- Table: Insert and format tables for organized data presentation.
- The text box labeled Email Subject lets users define the subject line for the report email. In this case, it is set as "Testcase Execution Report". This subject appears as the title of the email received by the recipents.
- The SEND EMAIL button allows users to send the execution report directly to team members or stakeholders. Once clicked, the system attaches the report and sends it with the specified subject line.
- The DOWNLOAD button enables users to download a copy of the execution report for offline sharing or record-keeping.

Build To Build Comparison
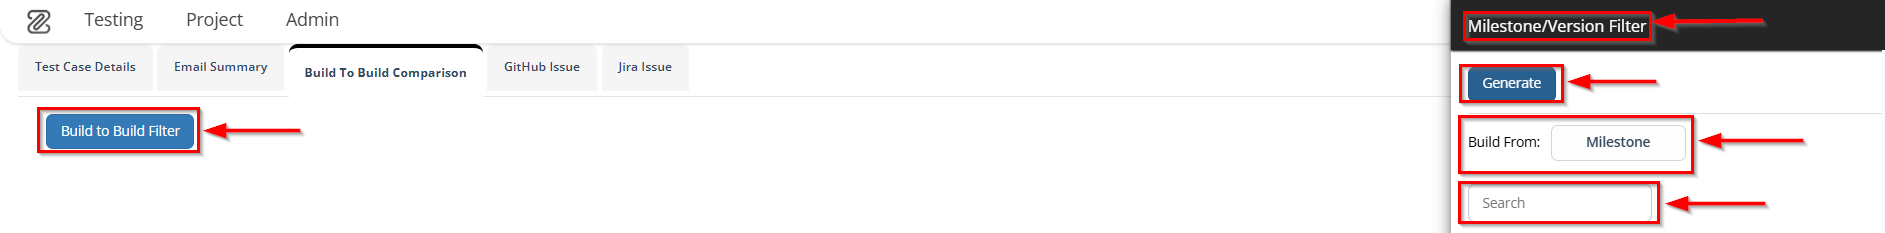
- After clicking the Build To Build Filter option, a window titled "Milestone/Version Filter" appears. Here, users can apply a filter to compare test results across different milestones or versions.
- The panel includes the following elements:
- A Generate button to execute the filter and display comparative results.
- A Build From field that allows users to select whether the comparison will be based on a "Milestone" or a "Version".
- A Search bar to quickly locate a specific milestone or version from the available list.
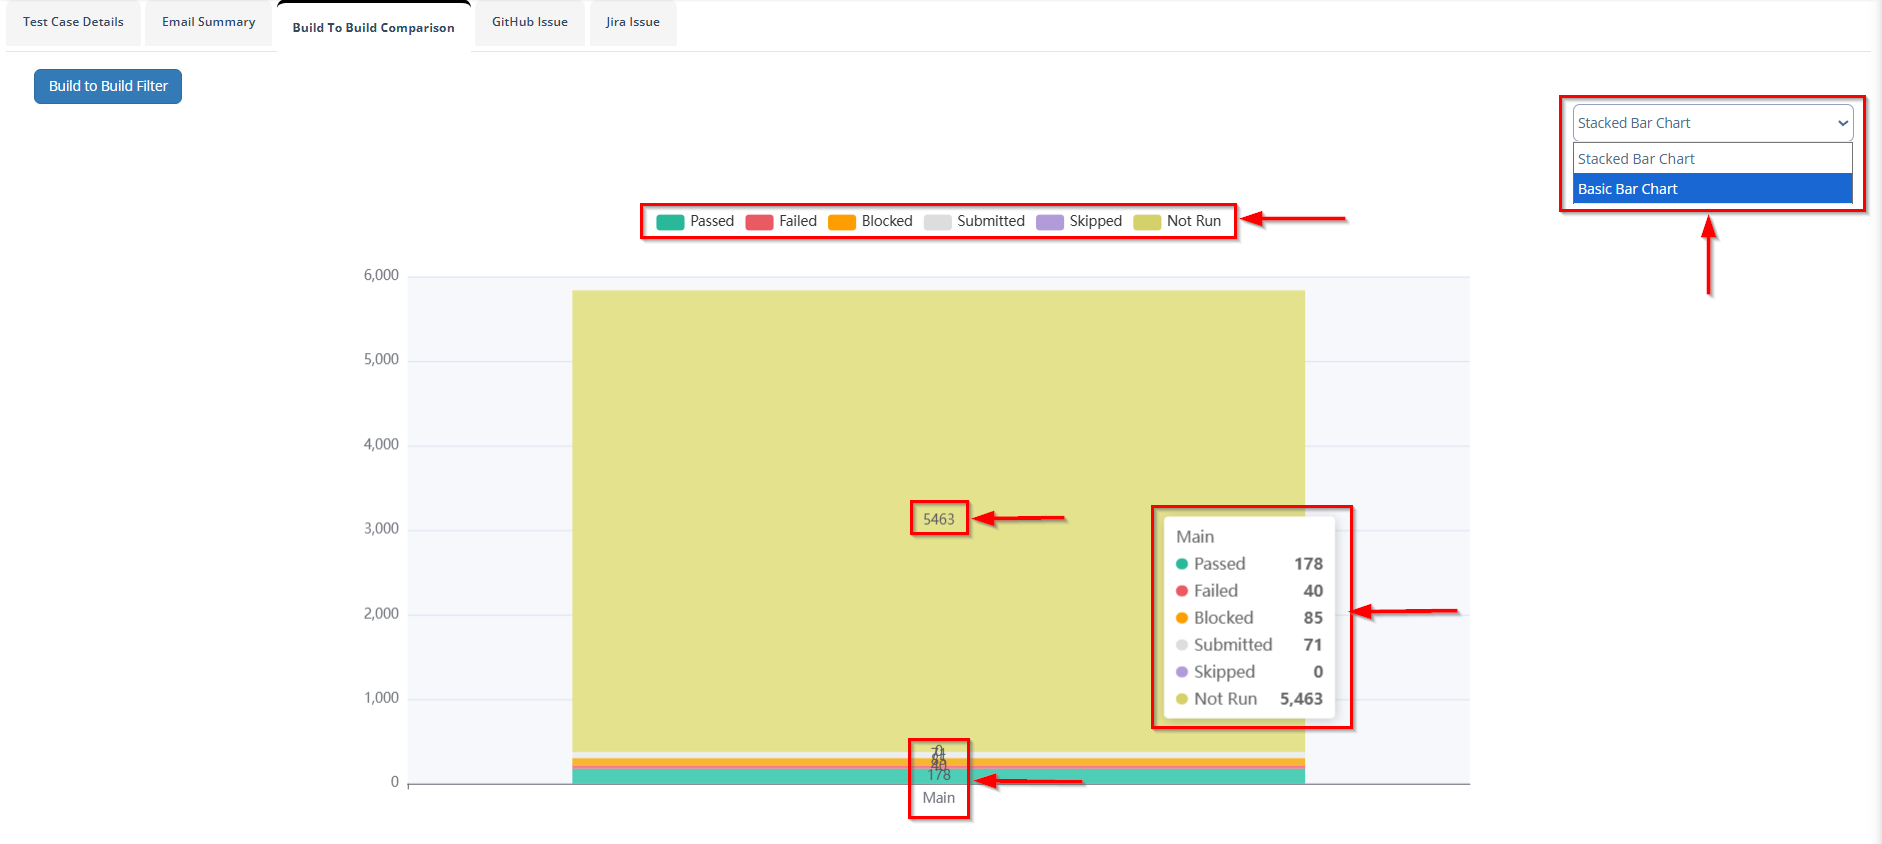
- It presents a bar chart showing the distribution of test case results for a particular build named "Main".
- Each test status is represented by a distinct color, including:
- Passed (178): Test cases that executed successfully.
- Failed (40): Test cases that did not meet the expected outcome.
- Blocked (85): Test cases that could not proceed due to dependencies or issues.
- Submitted (71): Test cases that have been submitted for review or further action.
- Skipped (0): No test cases were skipped.
- Not Run (5,463): Test cases that were not executed.
- The chart provides a visual comparison of execution statuses, helping teams analyze build stability and identify testing progress across multiple builds.
- The dropdown on the top-right corner allows switching between Stacked Bar Chart and Basic Bar Chart views for better visualization.
GitHub Issue
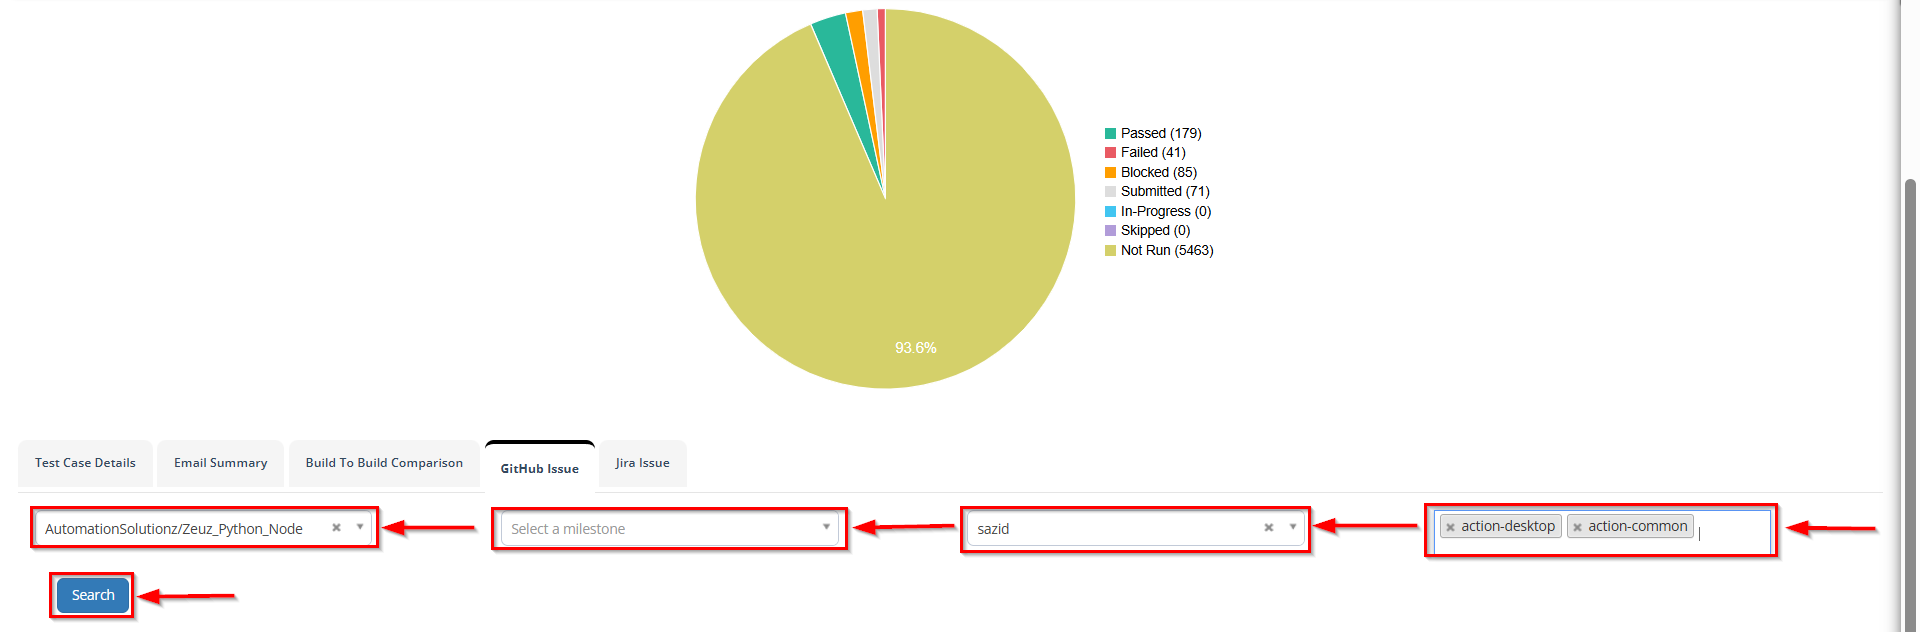
- This interface allows users to view or filter test cases linked with the issue.
- It includes multiple dropdowns and fields:
- The repository field (e.g., AutomationSolutionz/ZeuZ_Python_Node) specifies the GitHub project linked to the execution.
- The milestone field lets users select a particular milestone associated with the issue.
- The user field (e.g., Sazid) filters issues assigned to a specific user.
- The labels field (e.g., action-desktop, action-common) helps narrow down issues based on GitHub labels.
- The Search button is used to retrieve the filtered GitHub issues based on the selected parameters.
Jira Issue
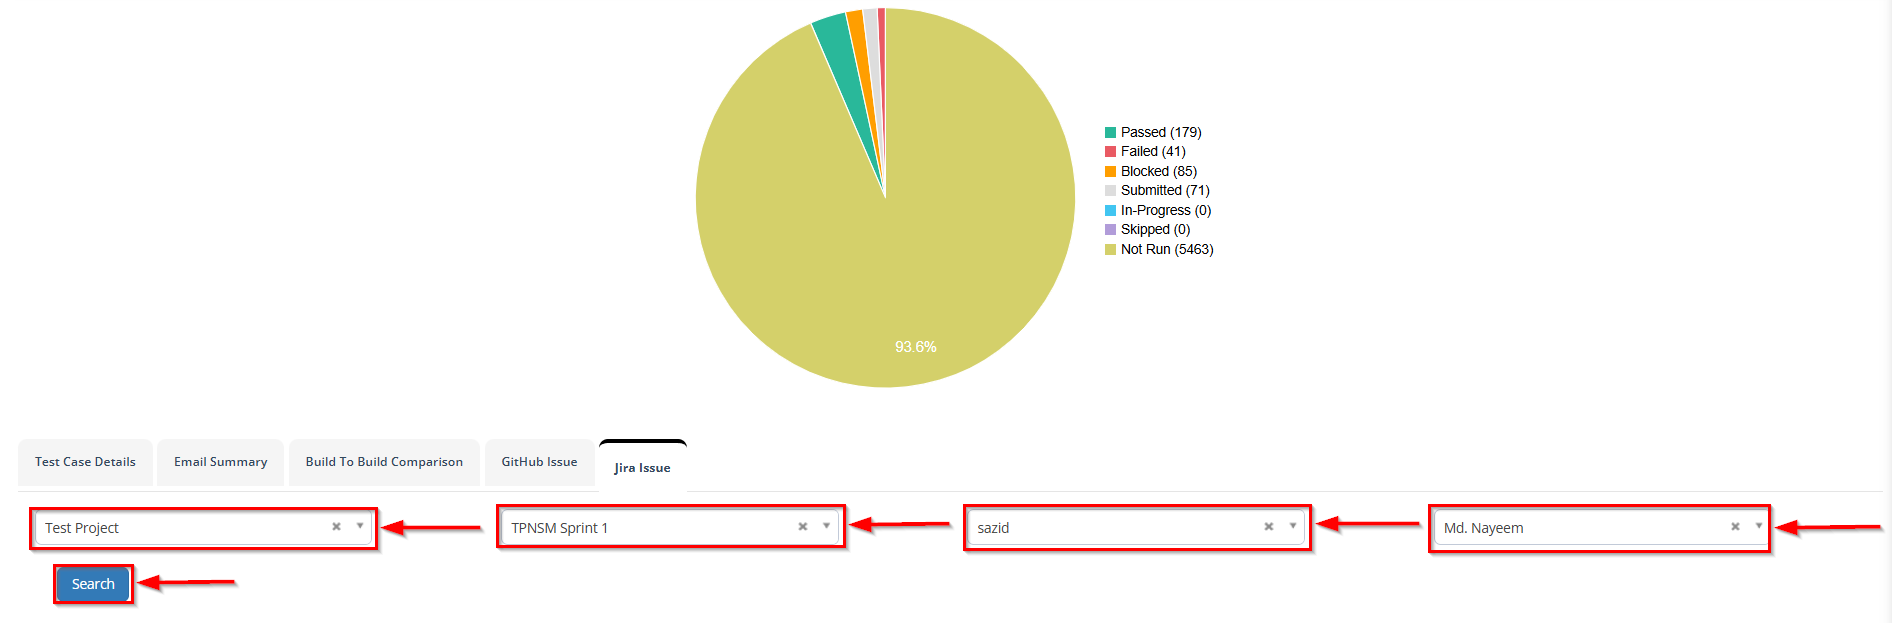
- This interface allows users to filter and view test cases that are linked with Jira issues.
- It contains several dropdown menus for filtering purposes:
- The Project field (e.g., Test Project) specifies the Jira project associated with the test execution.
- The Sprint field (e.g., TPNSM Sprint 1) helps in filtering issues based on specific sprints.
- The Reporter field (e.g., Sazid) indicates the user who has reported or logged the issue in Jira.
- The Assignee field (e.g., Md.Nayeem) specifies the user responsible for resolving or addressing the issue.
- After selecting the desired filters, the Search button can be clicked to display the corresponding Jira issues.
FAQs / Troubleshooting
FAQs
What is an execution report
An Execution Report provides a detailed summary of test case results, including statuses such as, Passed, Failed, Blocked, Skipped, or Not Run.
Can I download the Execution Report?
Yes, users can download the report in supported formats directly from the interface.
Can I share the Execution Report via email?
Yes, the report can be sent through email by entering a subject and clicking the Send Email option.
What type of charts are available in the report?
The report supports both Stacked Bar Chart and Basic Bar Chart for visual comparison.
Can I filter test data before generating a report?
Yes, users can apply filters such as Milestone, Version, or Build to generate specific reports.
Troubleshooting
- Report not generating: Ensure that valid filters (e.g., Milestone or Version) are selected before clicking Generate.
- Email not sent: Check the entered email address and ensure that the email subject is provided before sending.
- Missing or incomplete data in the report: Verify that test executions are completed and results are updated in the system.
- Charts not visible: Try refreshing the page or switching between chart types (Stacked/Basic) to reload data visualization.
- Slow report loading: This may occur due to a large number of test cases; try applying narrower filters to reduce data size.
Changelog
- Fixed Build-to-Build comparison bugs [20250518]