Release Report
A Release Report is a centralized dashboard that gives teams a clear picture of the health and progress of a software release. It brings together test results, issues, pull requests, vulnerabilities, and project updates into one place so that developers, QA, and managers can quickly understand the release status, identify risks, and make informed decisions.
Steps
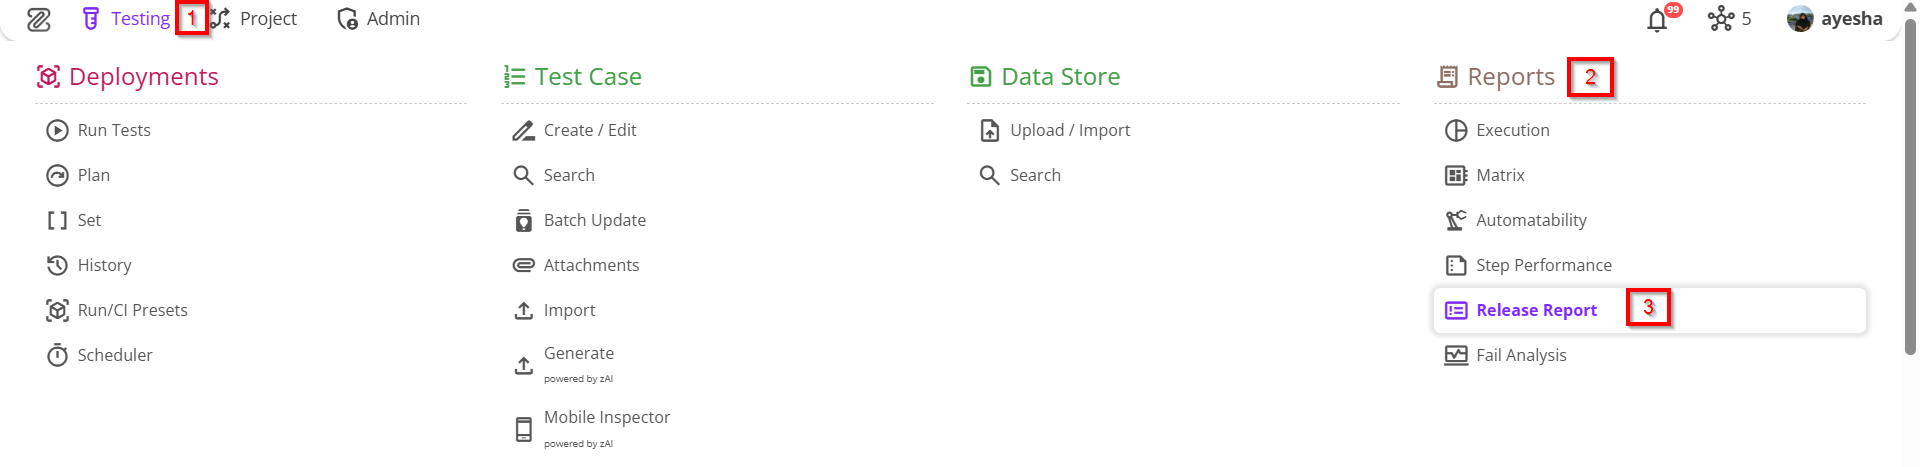
- From the menu bar, go to the Testing option and select the Release Report feature under Reports.
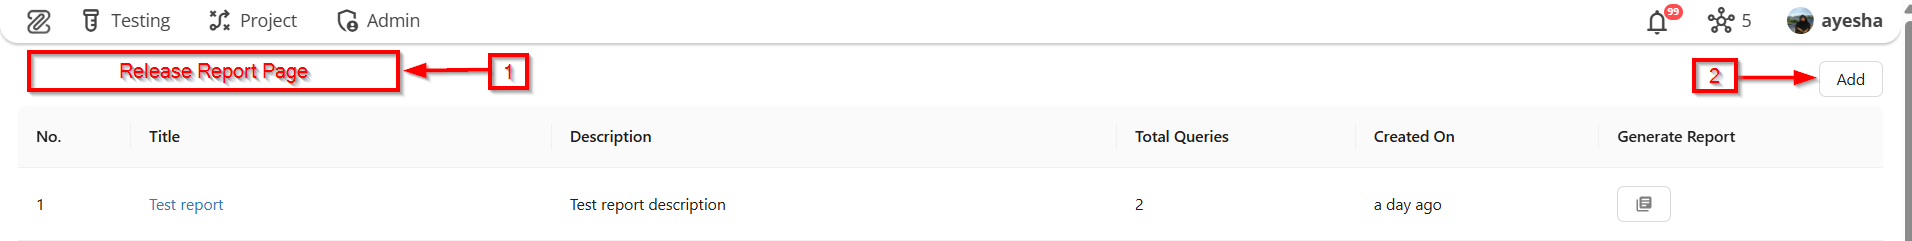
- Go to the Release Report page.
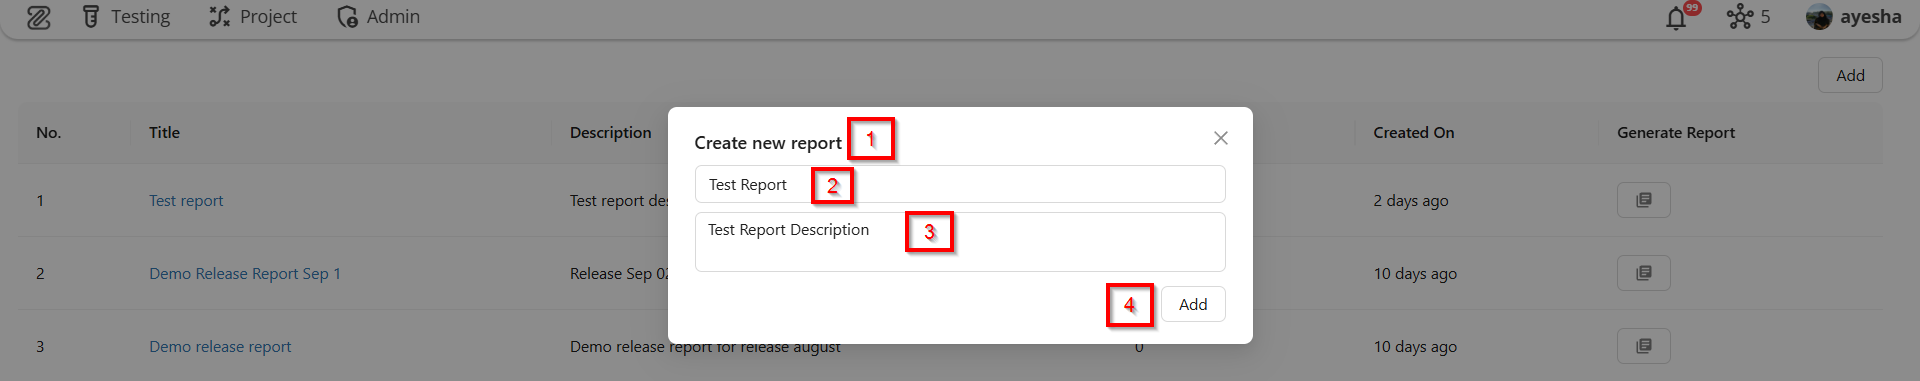
- To create a new report, click on the Add button located at the top right. Then, a window named "Create New Report" will appear. Next, enter the Report Title followed by the Report Description. After filling in all the required fields, click on the Add button again. A new report will then be created.
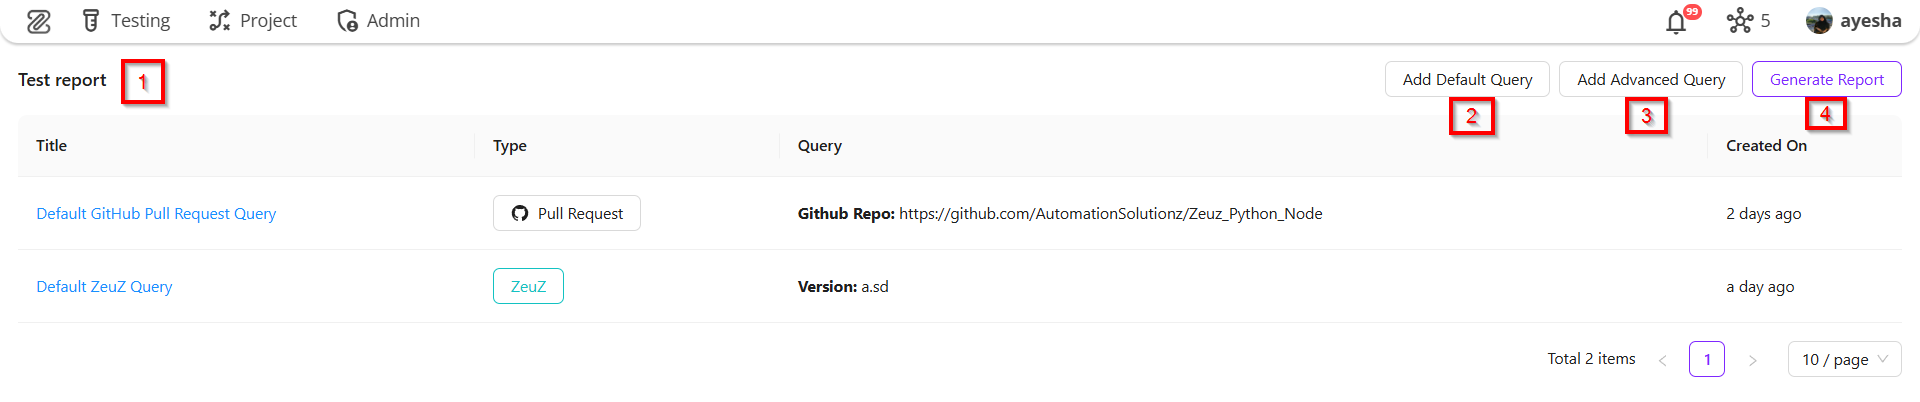
- If we click on a specific report, three options will be displayed at the top right of the page.
- Add Default Query
- Add Advanced Query
- Generate Report.
Add Default Query
It means saving or setting up a pre-defined query that will be automatically applied when a page, report, or database view is opened.
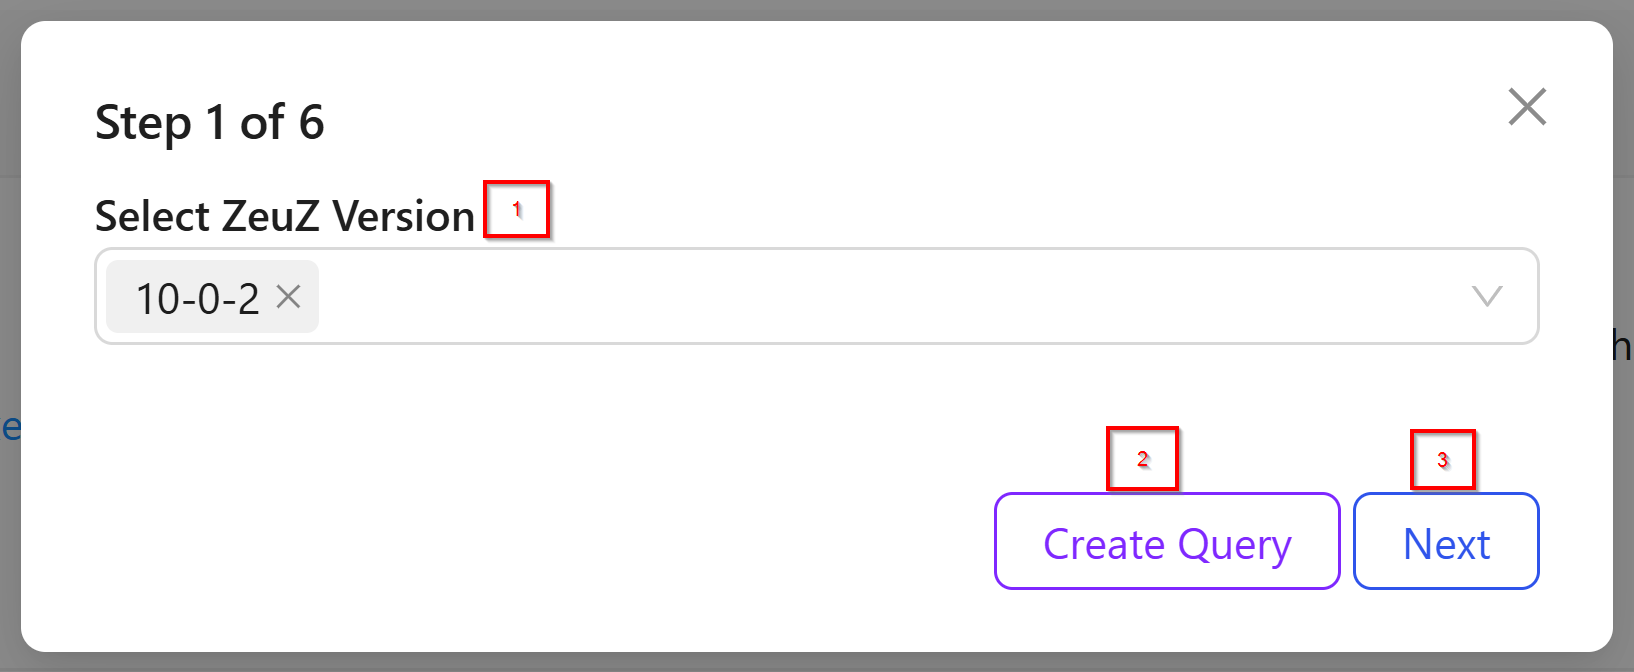
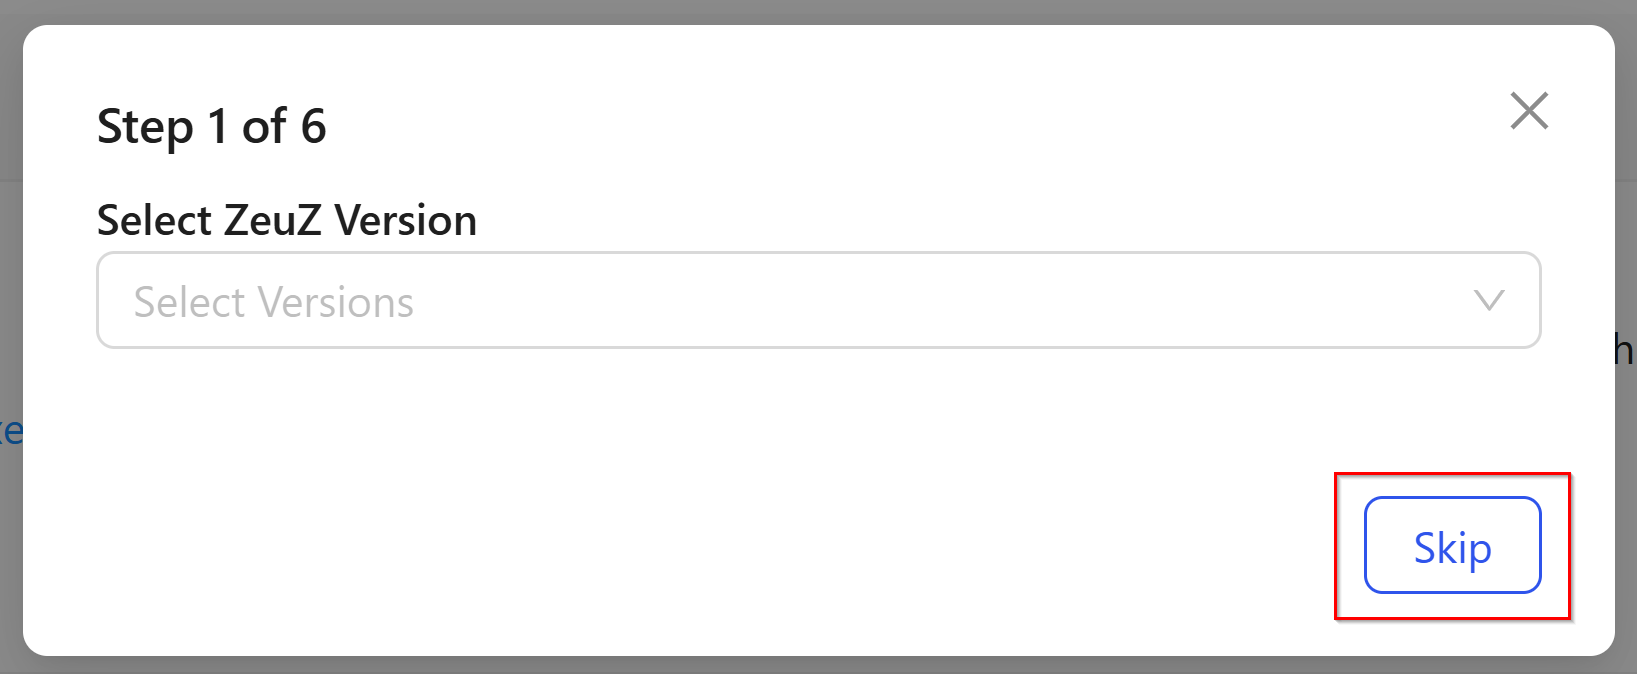
- Step 1: Select ZeuZ Version (e.g., 10-0-2). Multiple versions can also be selected. We can create a query by clicking the Create Query button if needed, or proceed to the next step by clicking the Next button. We can also skip the step, if required, by clicking the Skip button.
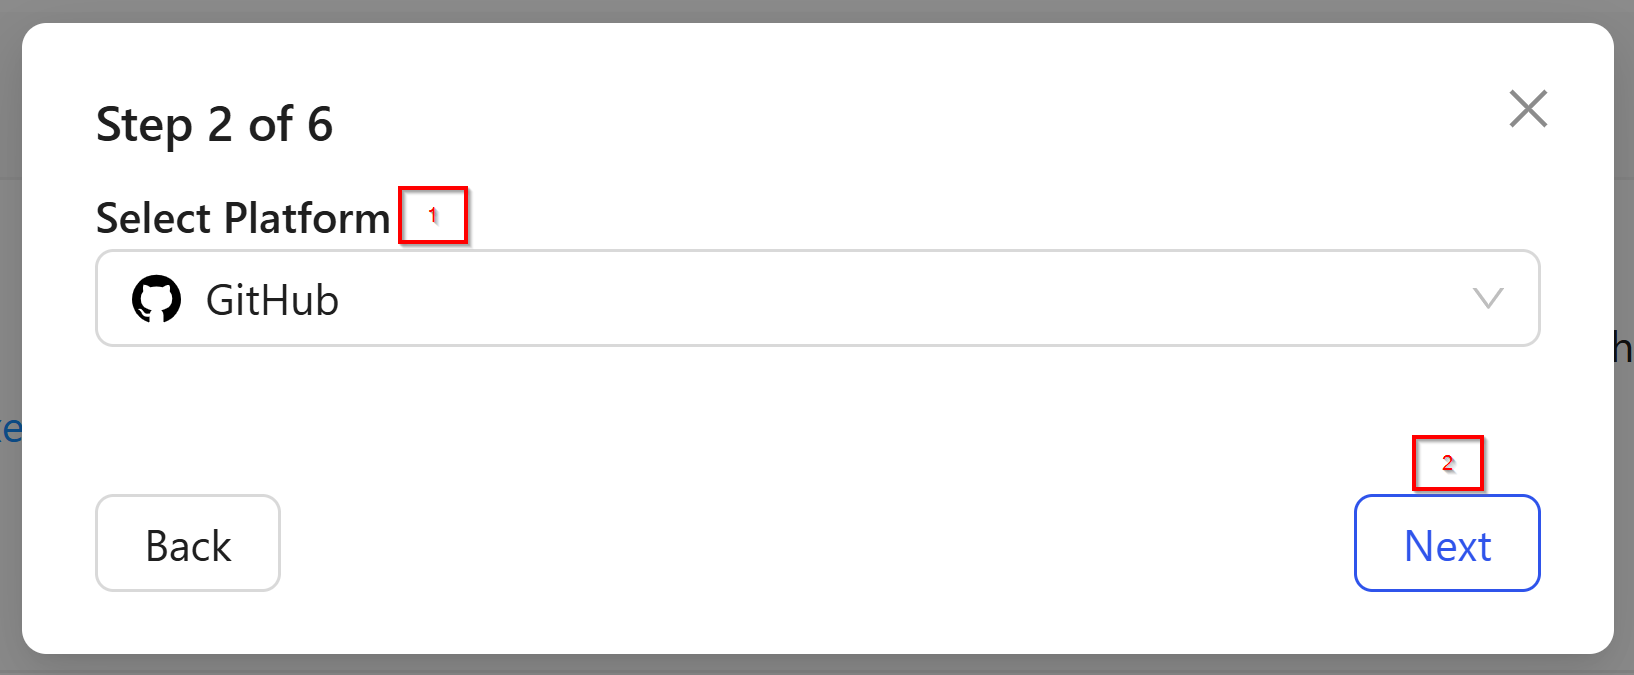
- Step 2: Select Platform (e.g., GitHub). In the default query, only the GitHub option is available. To proceed to the next step, click the Next button.
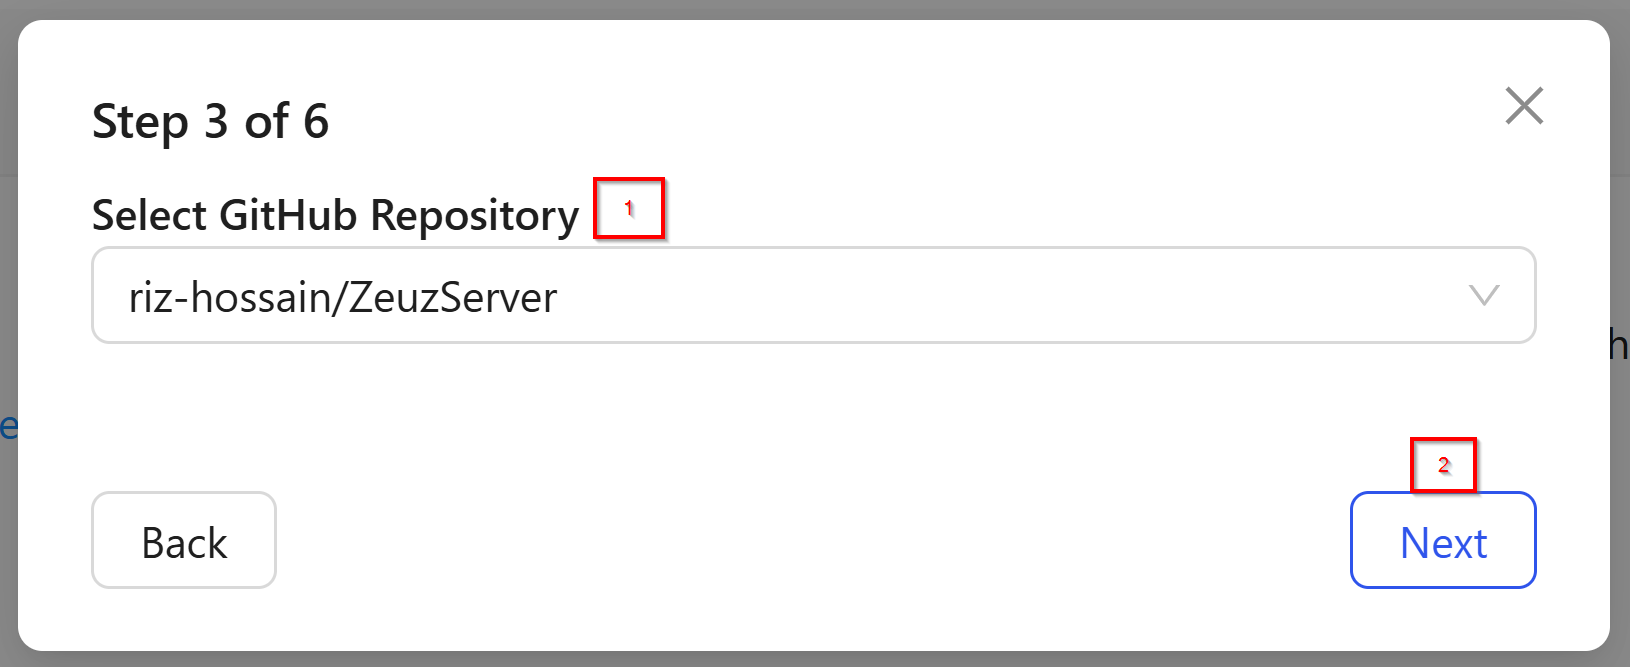
- Step 3: Select GitHub Repository (e.g., riz-hossain/ZeuzServer). If the repository is not displayed, it means that no repository has been linked to our account. If it is not linked, we need to go to the Admin section, select the GitHub option, and link the repository from there. Once it is linked, we can return to this page and select the repository.
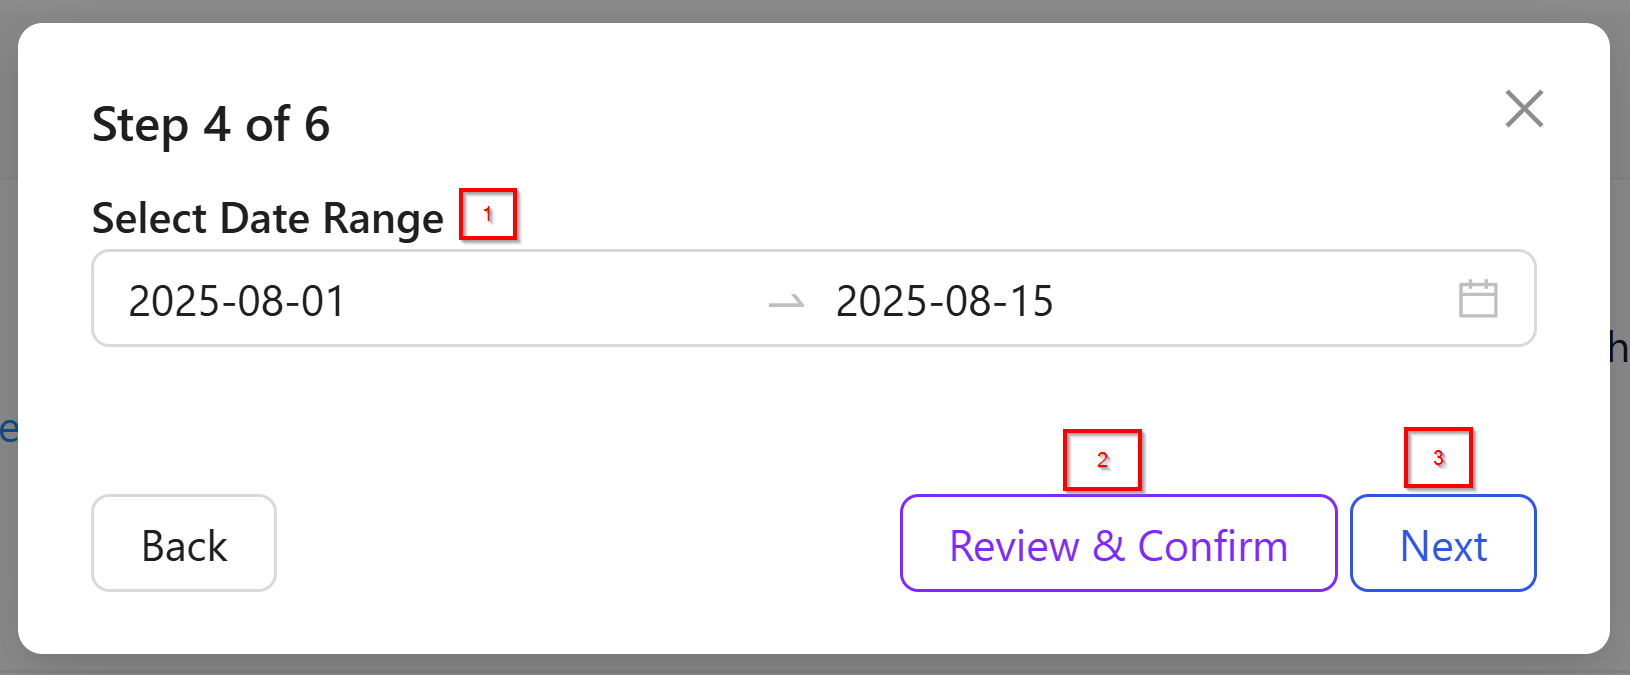
- Step 4: Select Date Range (e.g.,Start Date: 2025-08-01, End Date: 2025-08-15). Here, the date range is specifically for the pull requests in our GitHub repository. From here, we can review and confirm it and also we can go to the next step.
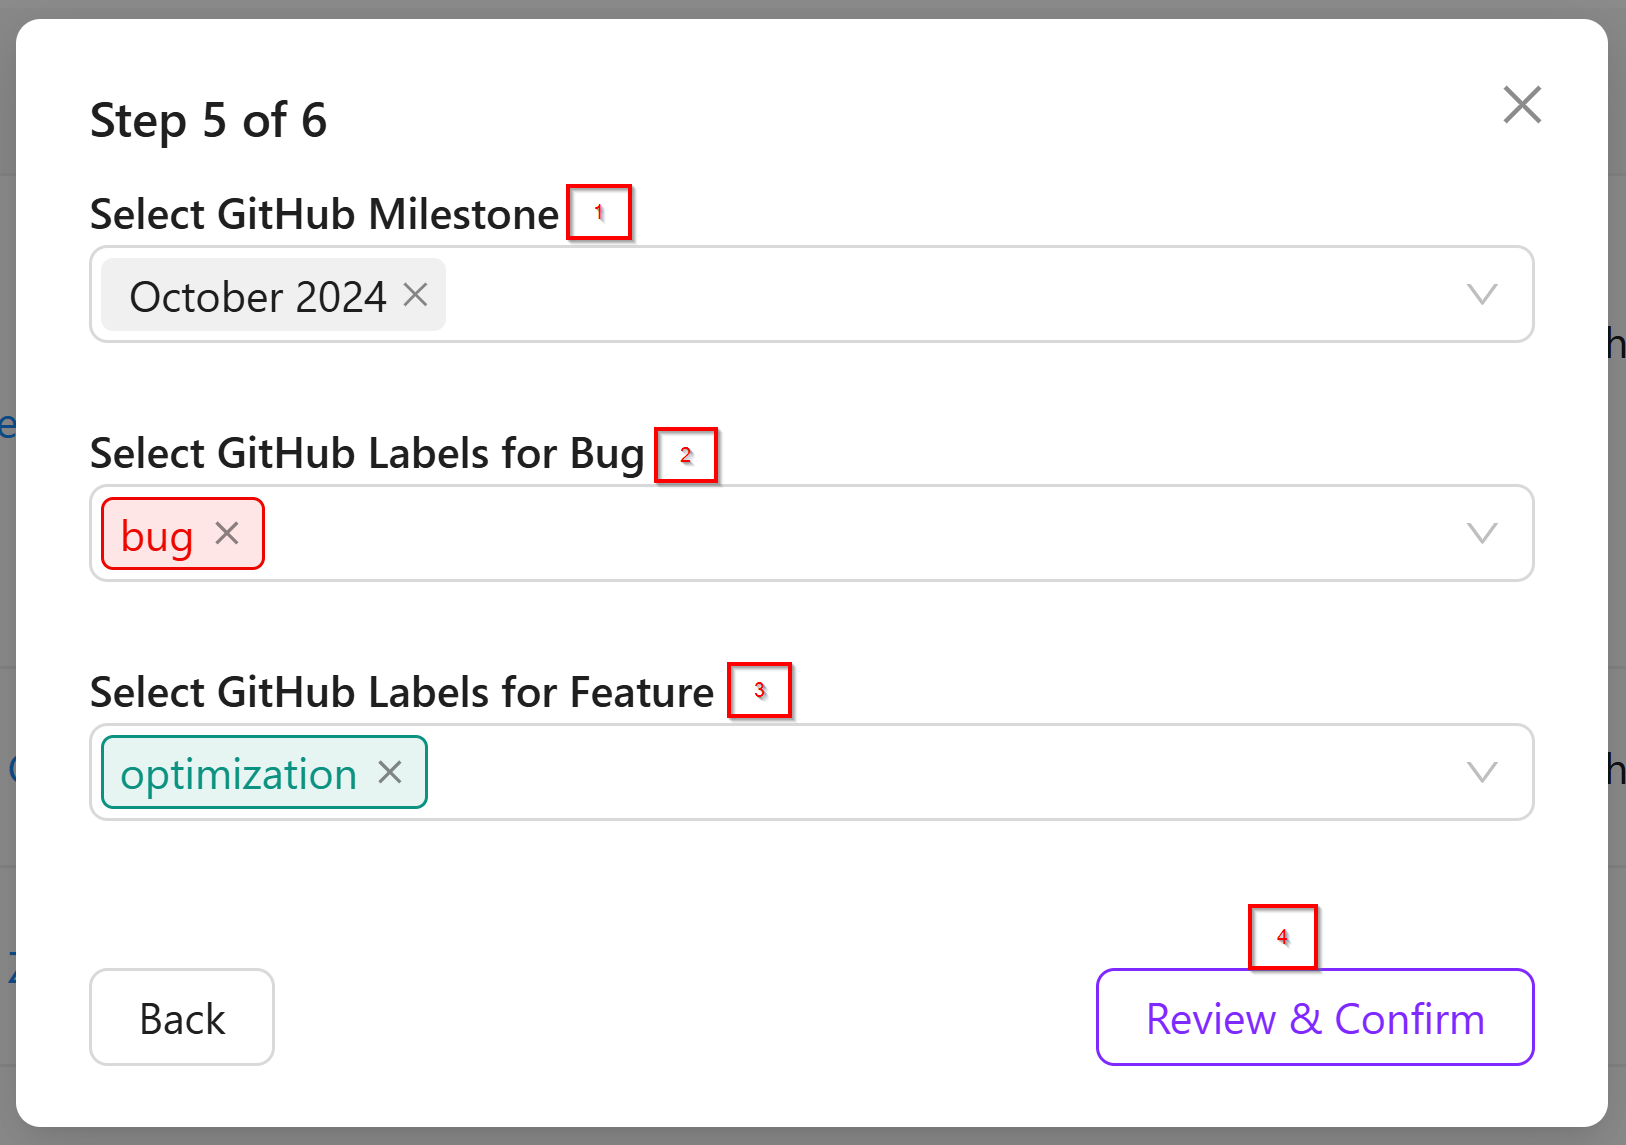
- Step 5: 1) Select GitHub Milestone
2) Select GitHub Labels for Bugs
3) Select GitHub Labels for Feature.
Here, we can select multiple pieces of information. We can also review and confirm.
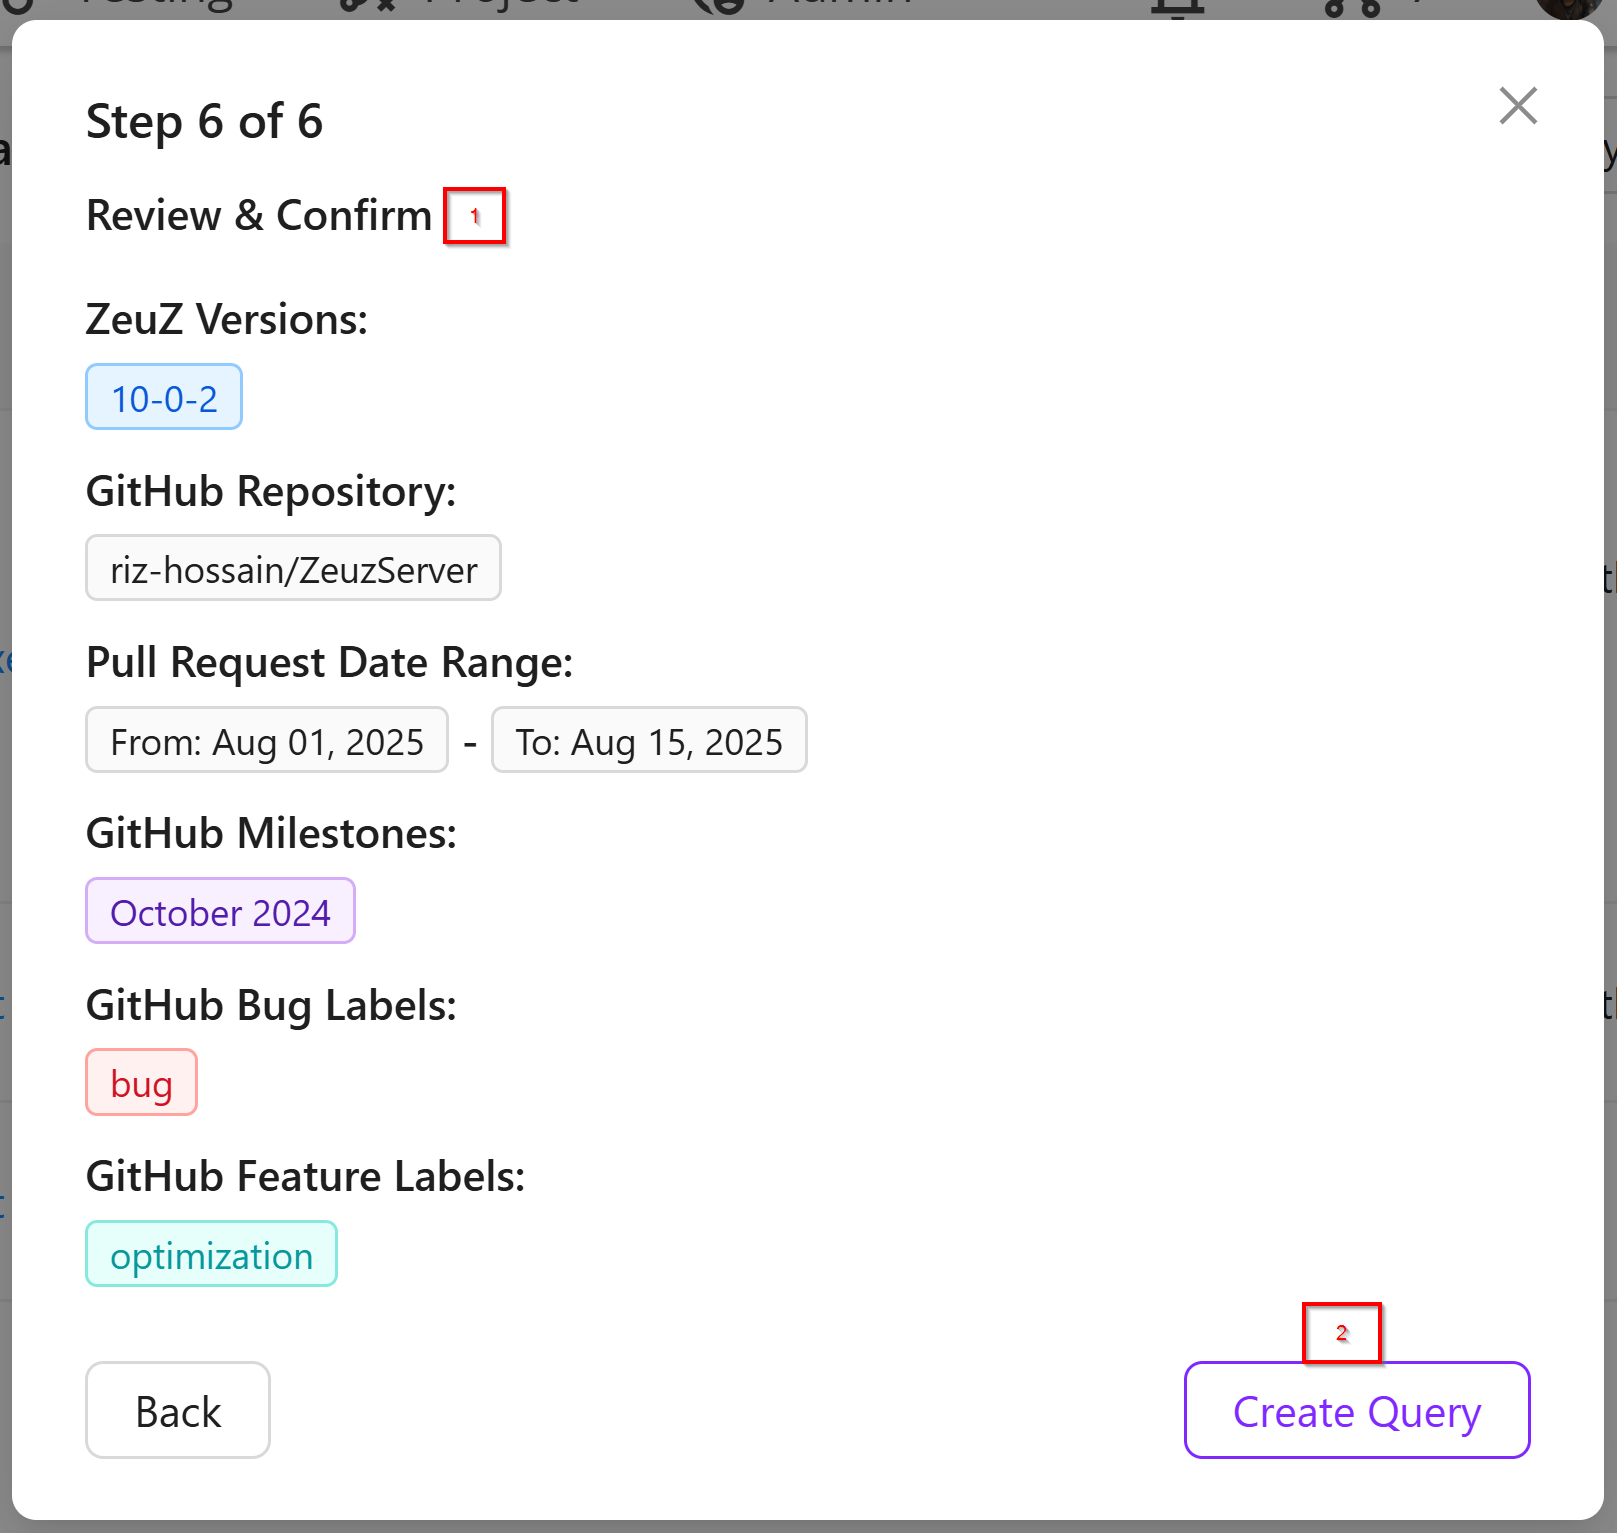
- Step 6: After clicking on the Review and Confirm option to check whether everything is correct. If everything is correct, clicking the Create Query button will automatically generate four queries for both GitHub and ZeuZ.
The Default Query is primarily provided to make it easier to supply information. In contrast, the Advanced query requires many types of information; selecting one option may prompt additional details, and multiple options are available. To prevent confusion during creation, the default query is provided.
Add Advanced Query
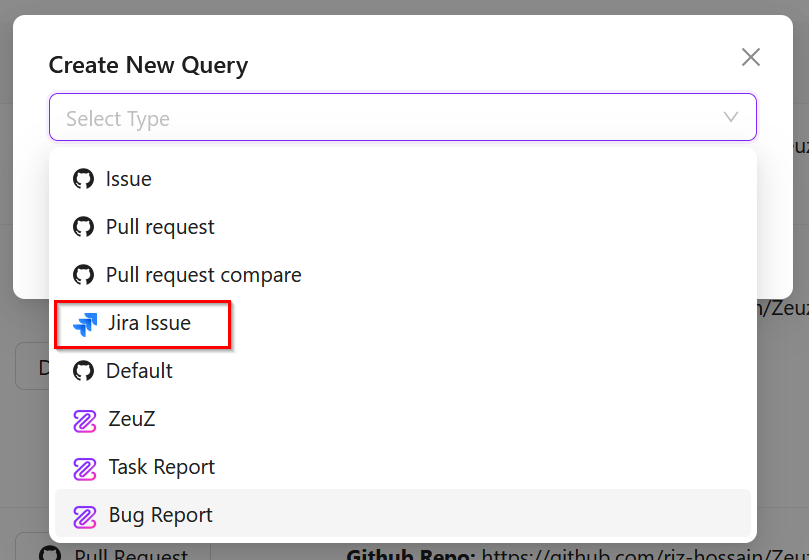
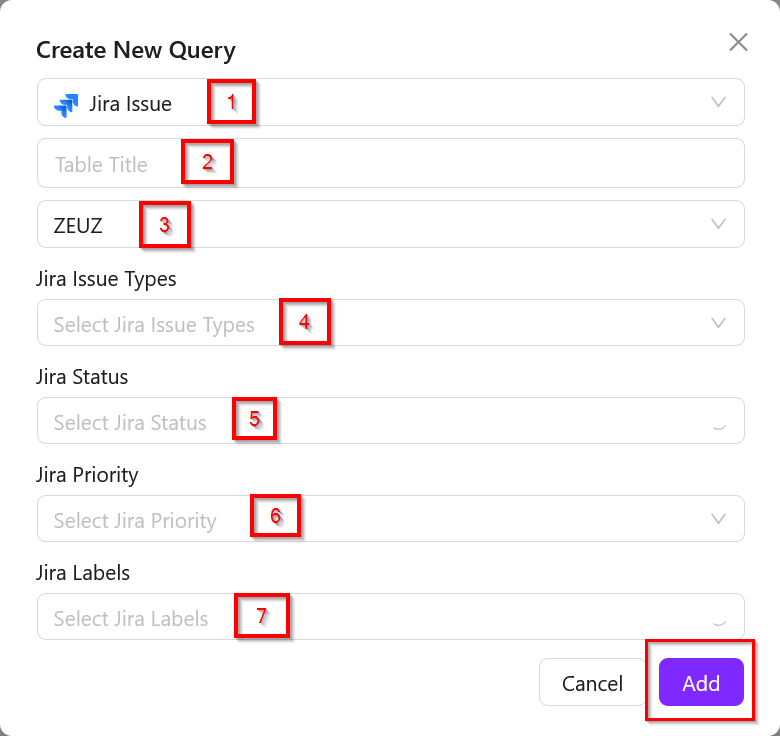
Here, in case of Add Advanced Query, the options displayed below depend on the selected type. For example:
- Select Type (Jira Issue)
- Table Title
- Jira Project
- Jira Issue Types
- Jira Status
- Jira Priority
- Jira Labels.
Then, click on the Add button to include the information.
- If we click on the Generate Report option, the report will be created. Generating the report takes some time. The more queries provided, the longer it will take. However, it shows the following information:
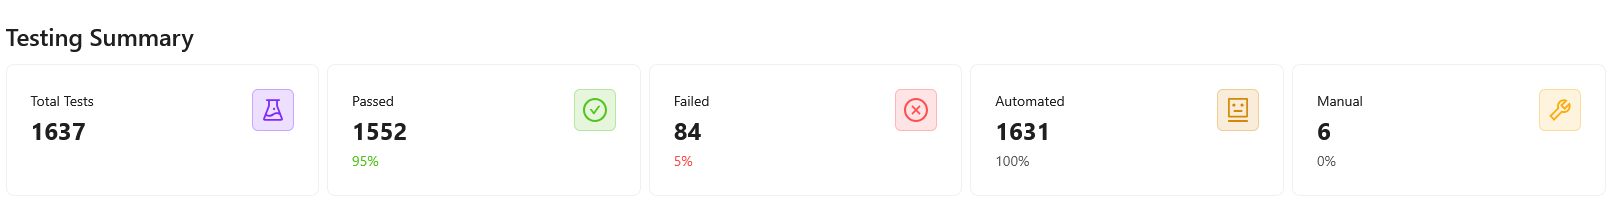
Testing Summary
The Testing Summary depends on the ZeuZ test cases, showing how many passed and how many failed. Here, the Failed count mainly includes both failed and blocked tests. Automated tests are included under Automation, while Hybrid, Undefined, and all other remaining tests are grouped under Manual.
Release Overview
The Release Overview section provides a concise summary of a specific release. Here’s a breakdown of its components:
- Title: Shows the name of the release, which in this case is Release R RD All. This helps users quickly identify the release.
- Description: Provides a short explanation or details about the release, here labeled as Demo Release Report.
- Created: Indicates when the release was created, showing a month ago, giving a sense of its recency.
- Release Manager: Displays the person responsible for managing this release, represented by a small profile image and labeled as Release Manager.

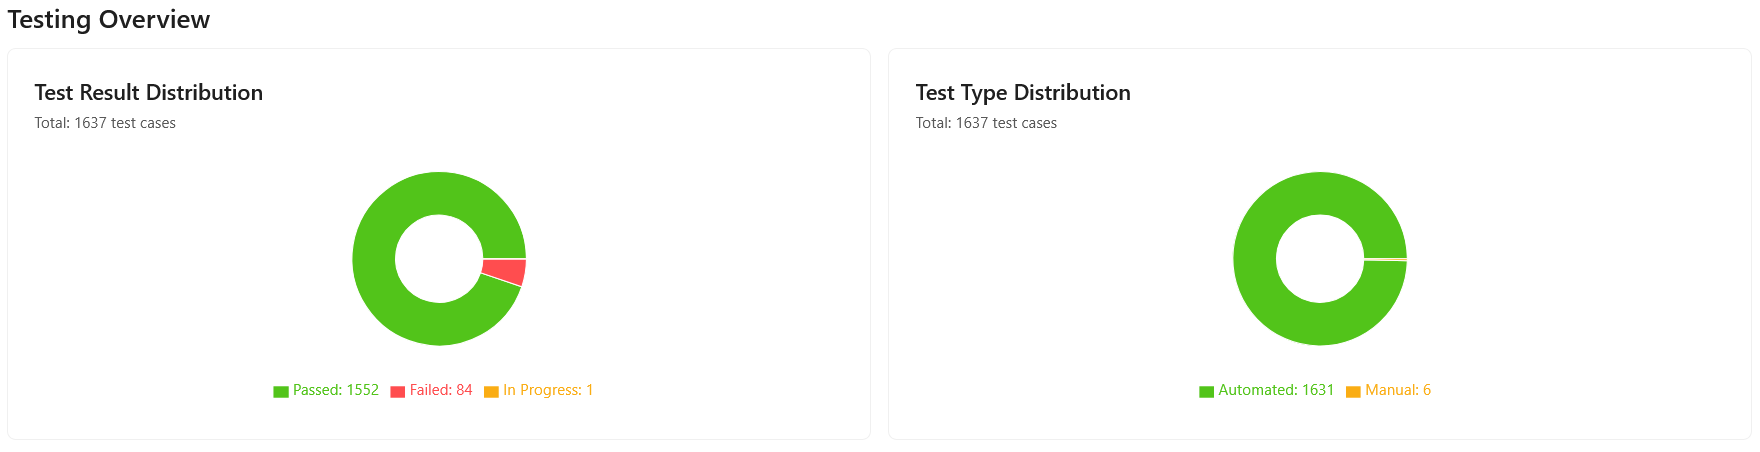
Testing Overview
The Testing Overview provides a visual summary of test case execution and distribution. It is divided into two parts:
- Test Result Distribution
- Total Test Cases: 1637
- Passed: 1552 (shown in green, representing the majority of test cases that were successful).
- Failed: 84 (shown in red, indicating unsuccessful test cases).
- In Progress: 1 (shown in yellow, meaning the test is still running and not yet completed).
This chart gives an immediate understanding of the overall success rate and identifies how many tests need attention due to failures.
- Test Type Distribution
- Total Test Cases: 1637
- Automated: 1631 (shown in green, representing nearly all the tests, which were executed automatically).
- Manual: 6 (shown in yellow, representing a very small portion executed manually).
This chart highlights the proportion of automated versus manual tests, showing that the testing process is highly automated.
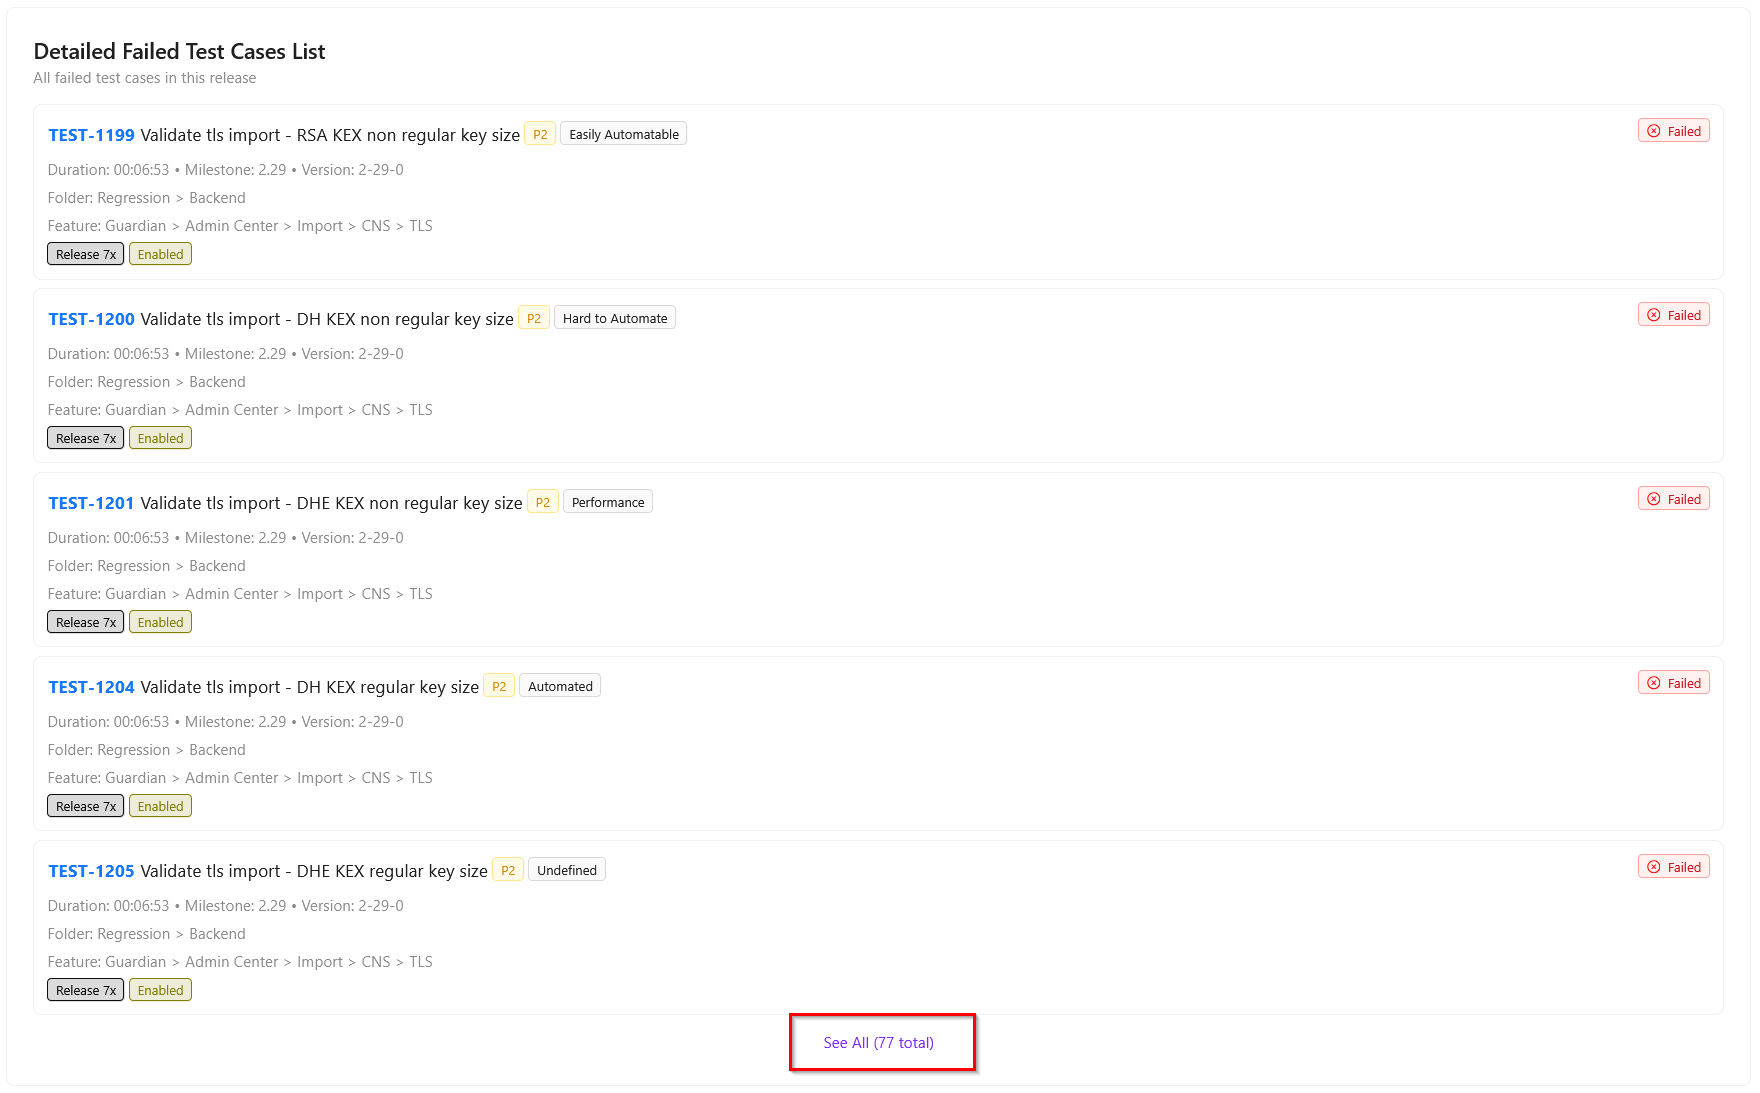
Detailed Failed Test Cases List
Here, only the failed test cases are shown. By clicking on See All, it will display all the failed test cases along with their total count.
GitHub Overview
The GitHub Overview provides a snapshot of a repository’s recent activity and changes. It typically includes two main sections:
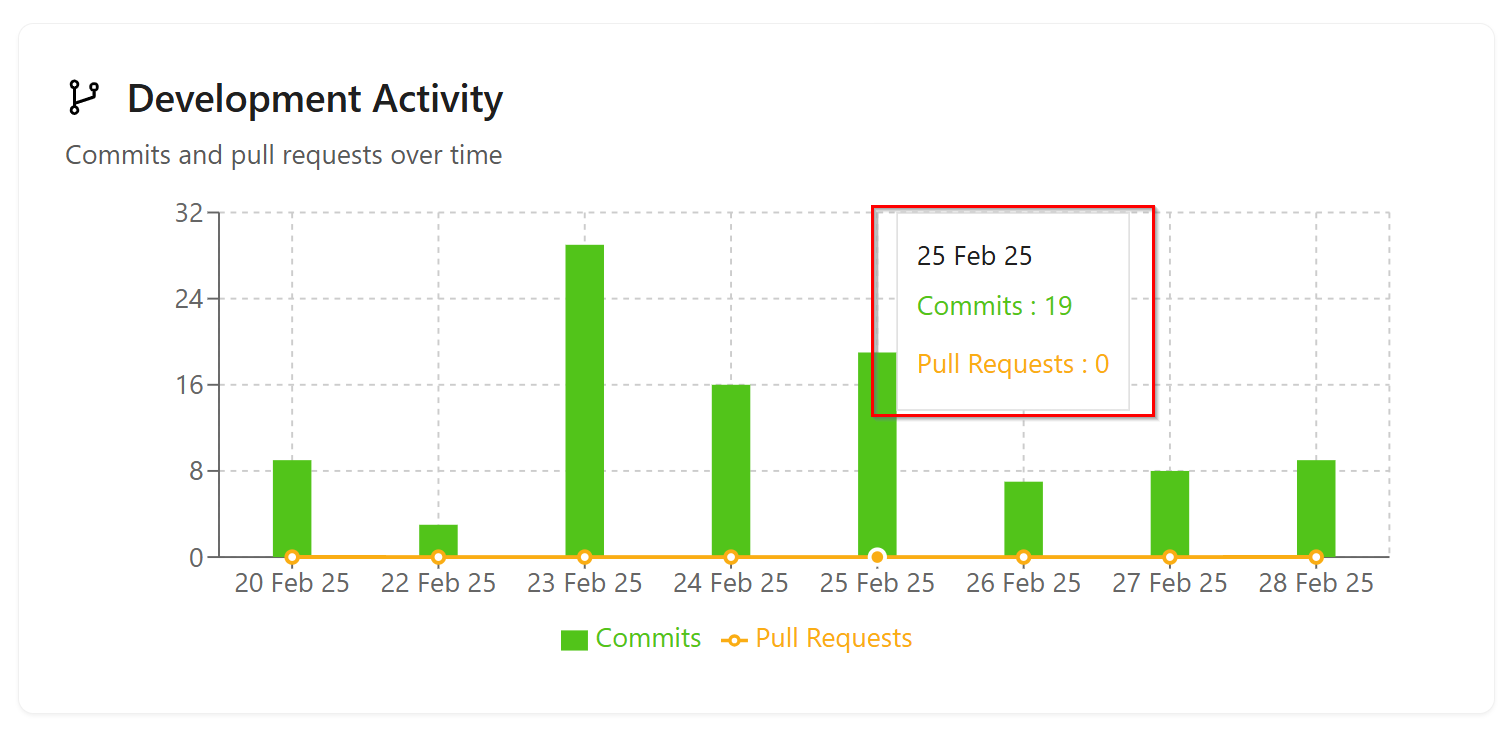
- Development Activity: Shows metrics such as the number of pull requests created, commits made, and contributions over a selected time period. The following image is a Development Activity chart from GitHub, showing commits and pull requests over a date range from 20 February 2025 to 28 February 2025.
Key points:
- X-axis (horizontal): Represents the dates in the selected range.
- Y-axis (vertical): Represents the number of commits and pull requests.
- Green bars: Indicate the number of commits made on each date.
- Orange line with dots: Represents the number of pull requests created on each date.
- Observation on 25 Feb 25: The tooltip shows that there were 19 commits and 0 pull requests on that day.
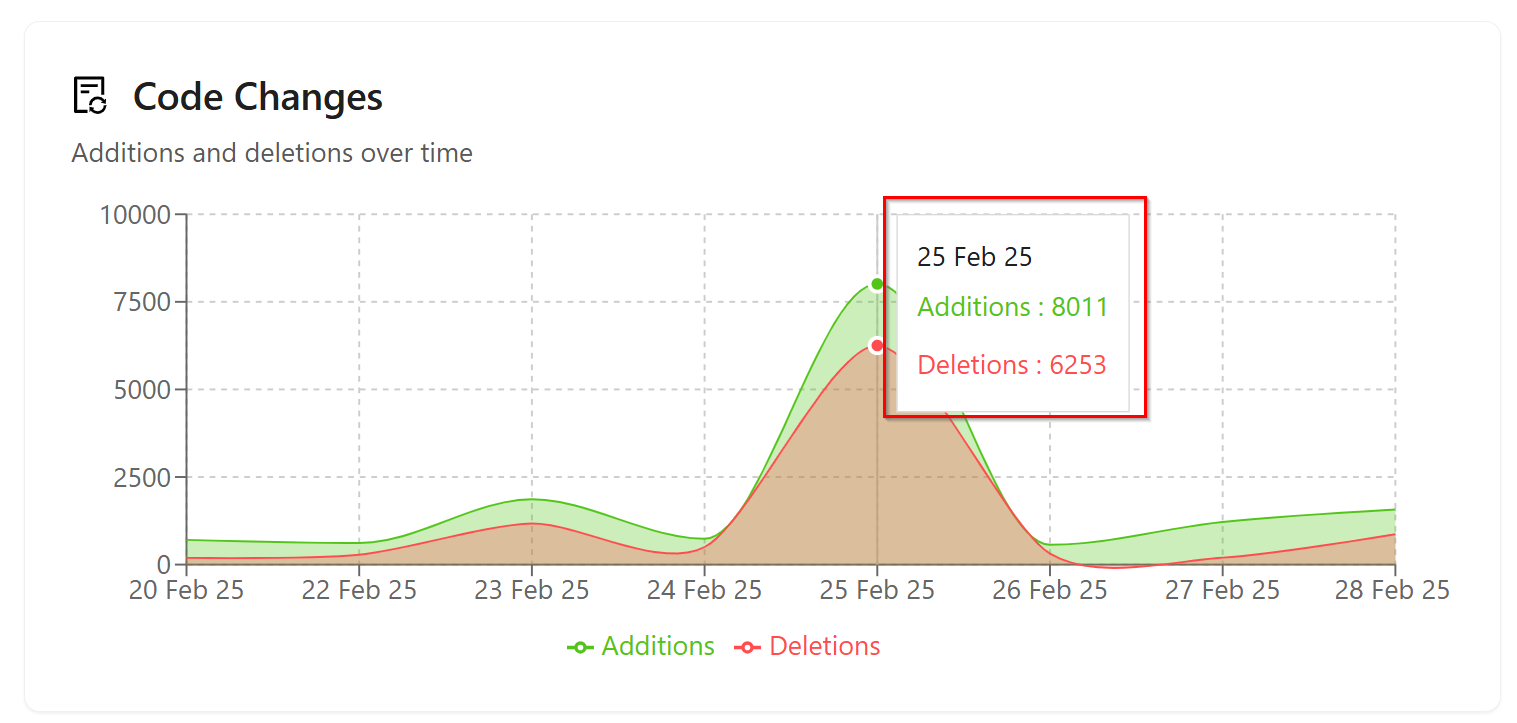
- Code Changes: It is a graphical representation of code changes over a specific period, titled “Code Changes: Additions and deletions over time.” It displays the number of lines of code added and deleted each day between 20 Feb 25 and 28 Feb 25.
Key points from the graph:
- X-axis: Dates ranging from 20 Feb 25 to 28 Feb 25.
- Y-axis: Number of lines of code, ranging from 0 to 10,000.
- Green line and shaded area: Represents additions (lines of code added).
- Red line and shaded area: Represents deletions (lines of code removed).
- Peak on 25 Feb 25:
- Additions: 8,011 lines of code added.
- Deletions: 6,253 lines of code removed.
This shows that the largest volume of code changes occurred on this date.
The graph shows that before and after 25 Feb, changes were relatively small, indicating most development activity occurred around that date.
We can also choose Jira if required. Since we have selected GitHub here, it is displaying the GitHub overview.
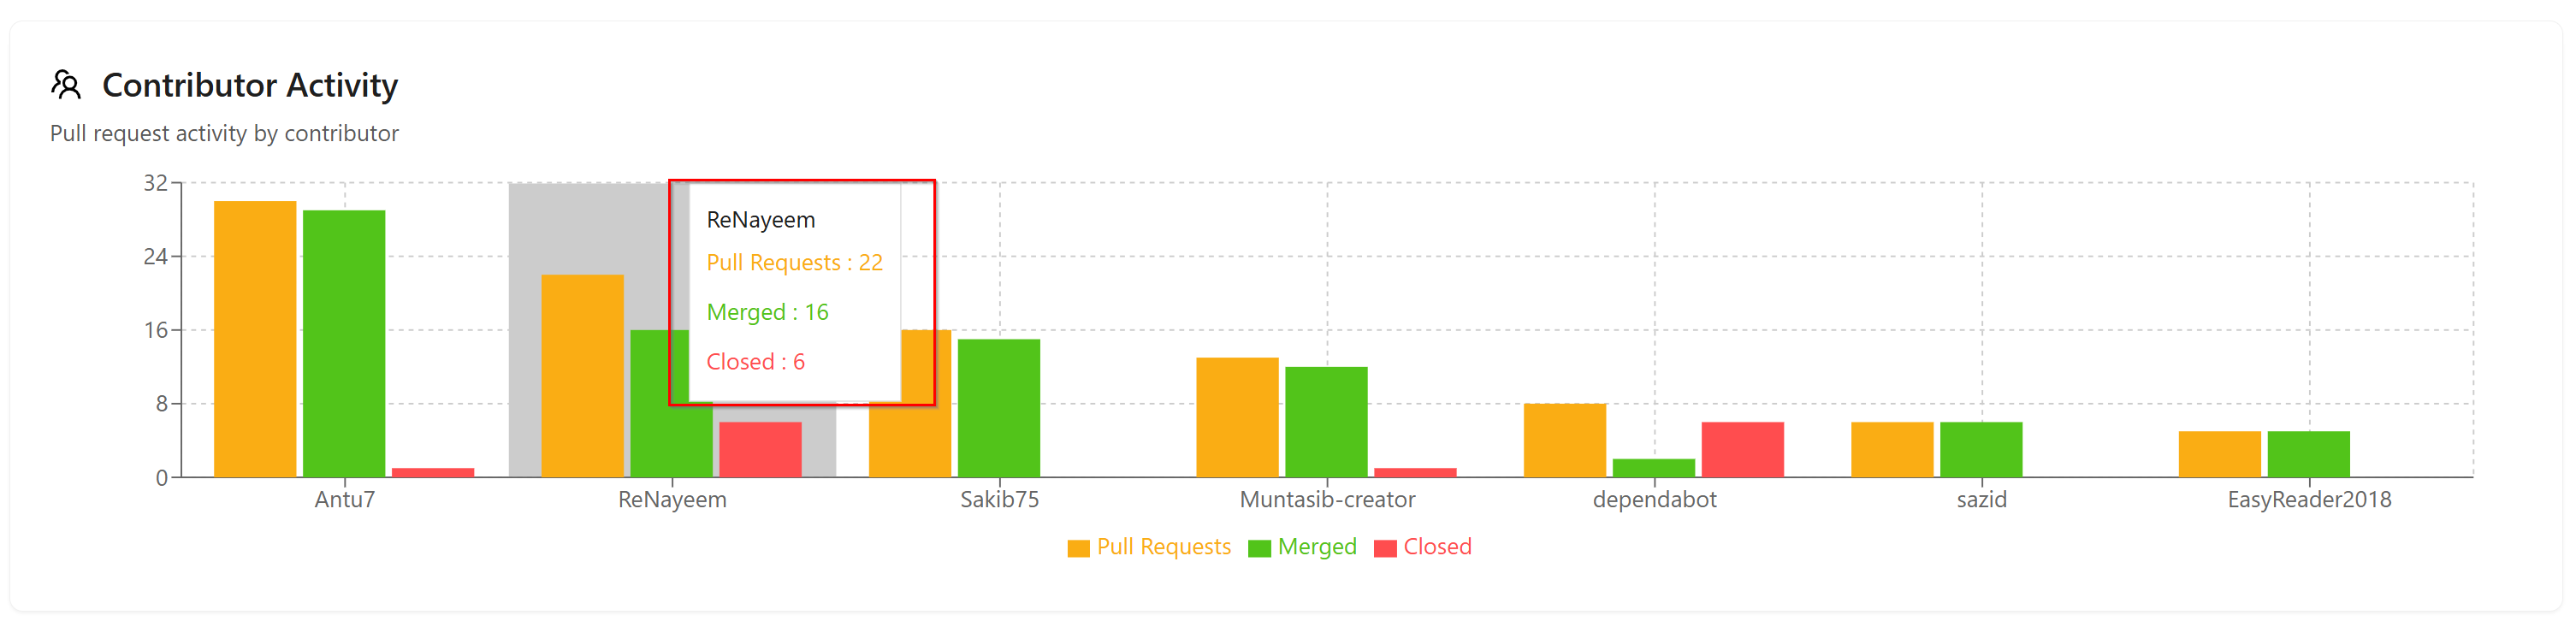
Contributor Activity
The Contributor Activity section shows how many pull requests each user has Created, Merged, and Closed. For example, in the following image:
- Contributor: ReNayeem
- Pull Requests: 22
- Merged: 16
- Closed: 6.
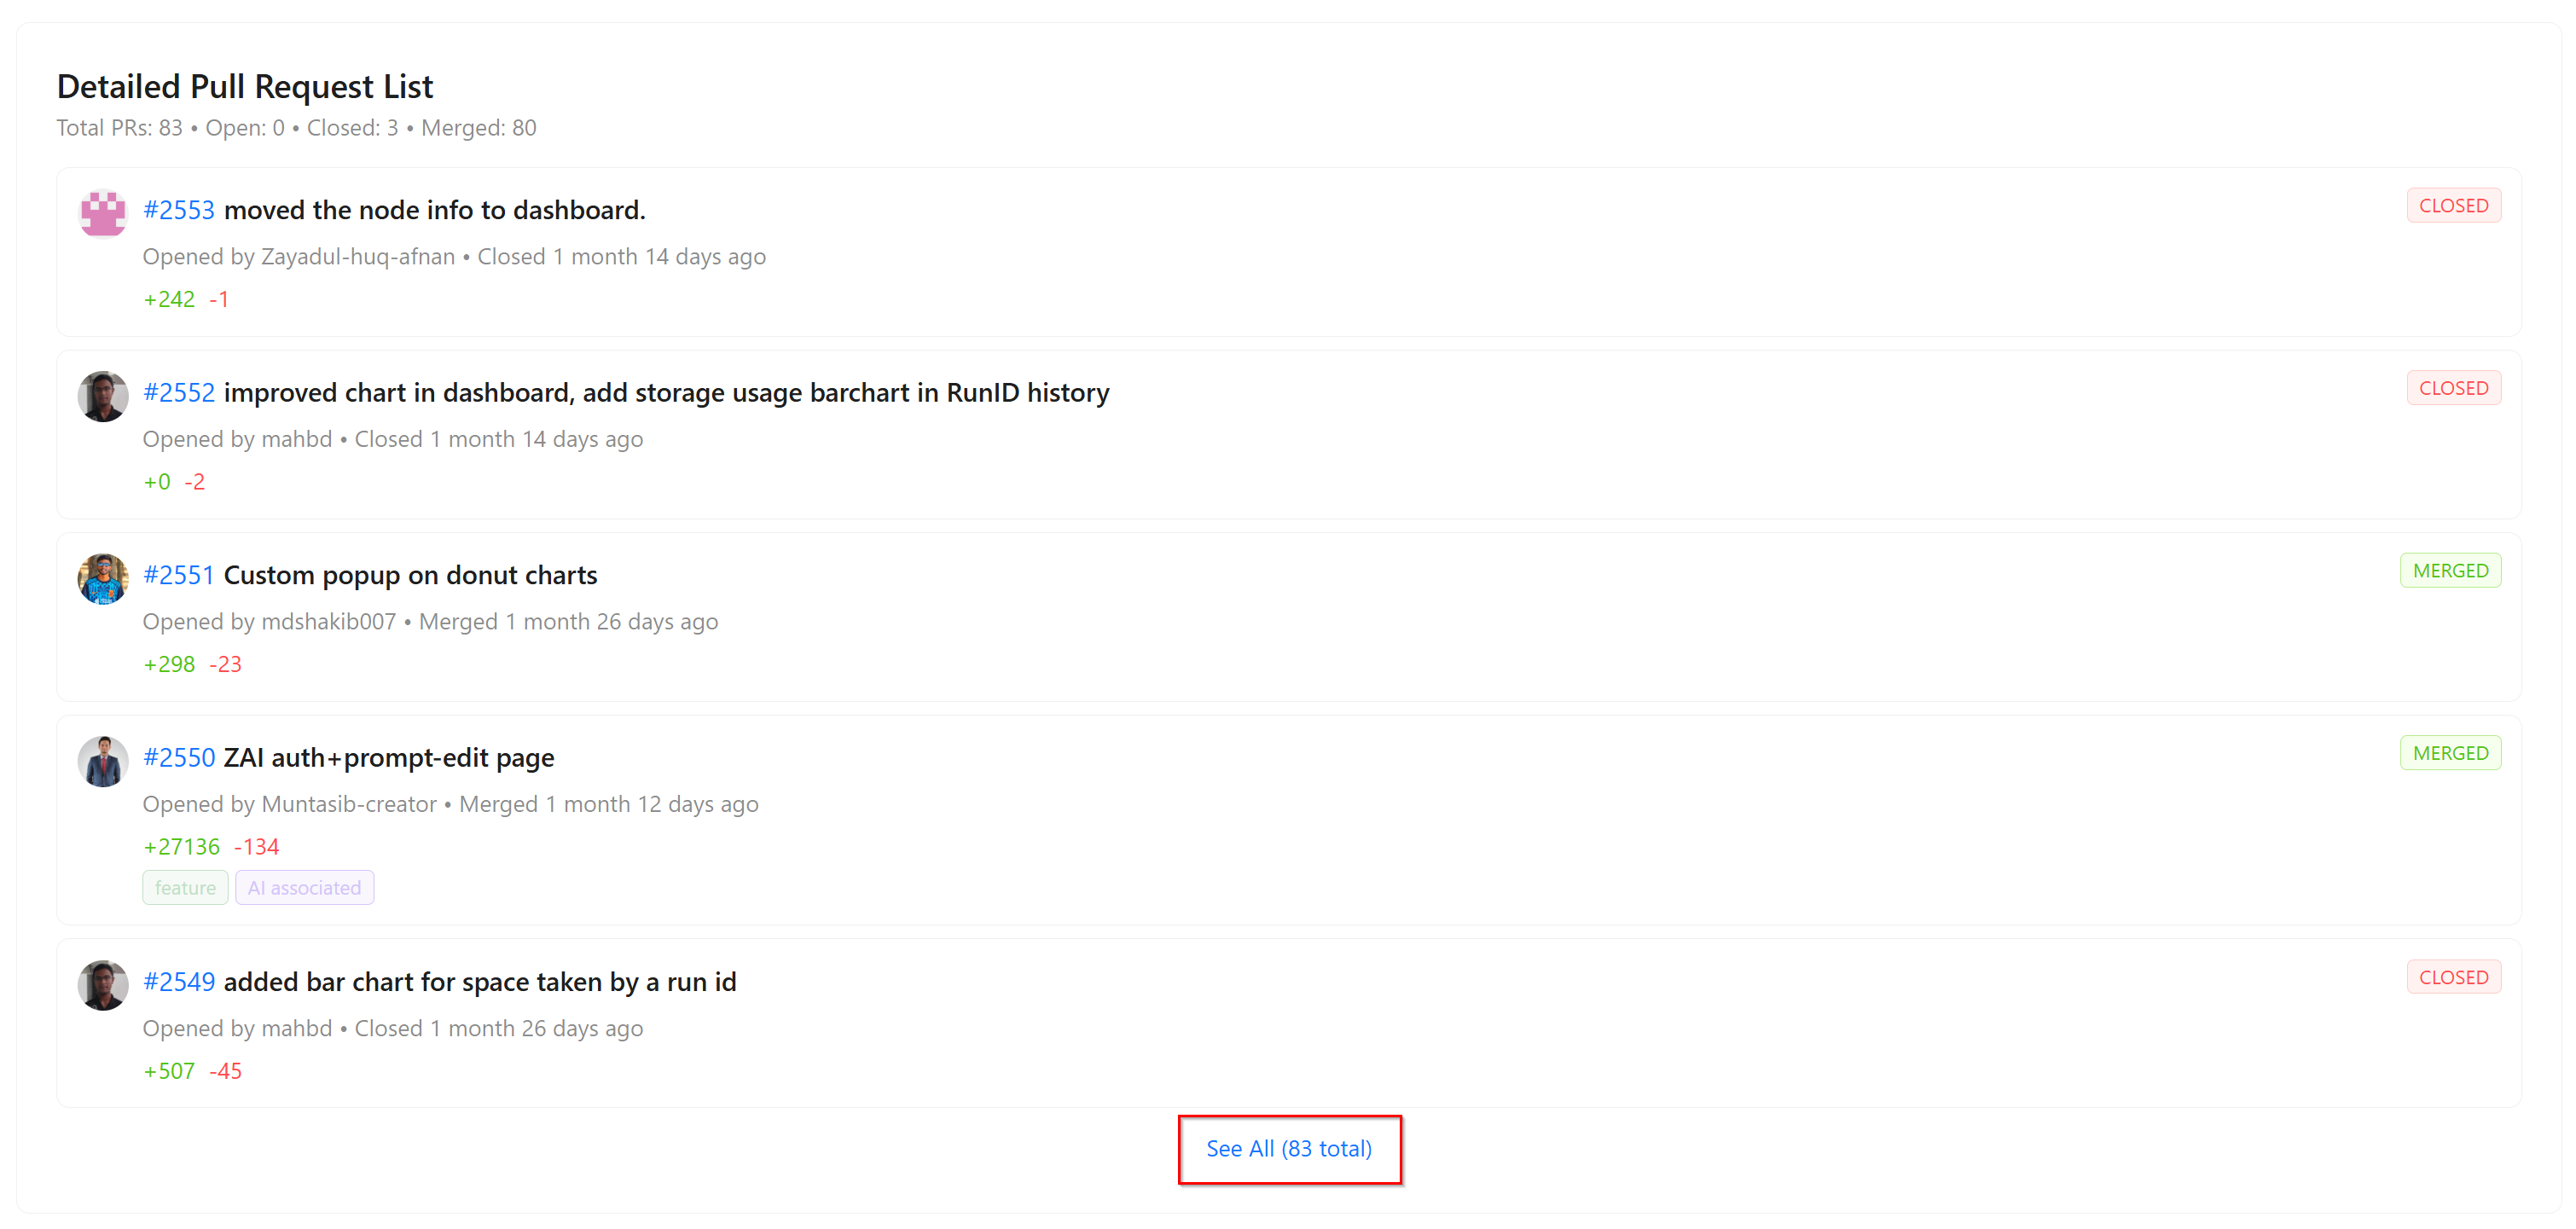
Detailed Pull Request List
A Detailed pull request provides comprehensive information about the pull requests that have been created. It shows who created the pull request, its ID, title, and the dates when it was opened, closed, or merged. It also displays how many lines of code were added or removed. If there are labels or milestones associated with the pull request, those will be shown as well. By clicking on See All, users can view the complete list of pull requests.
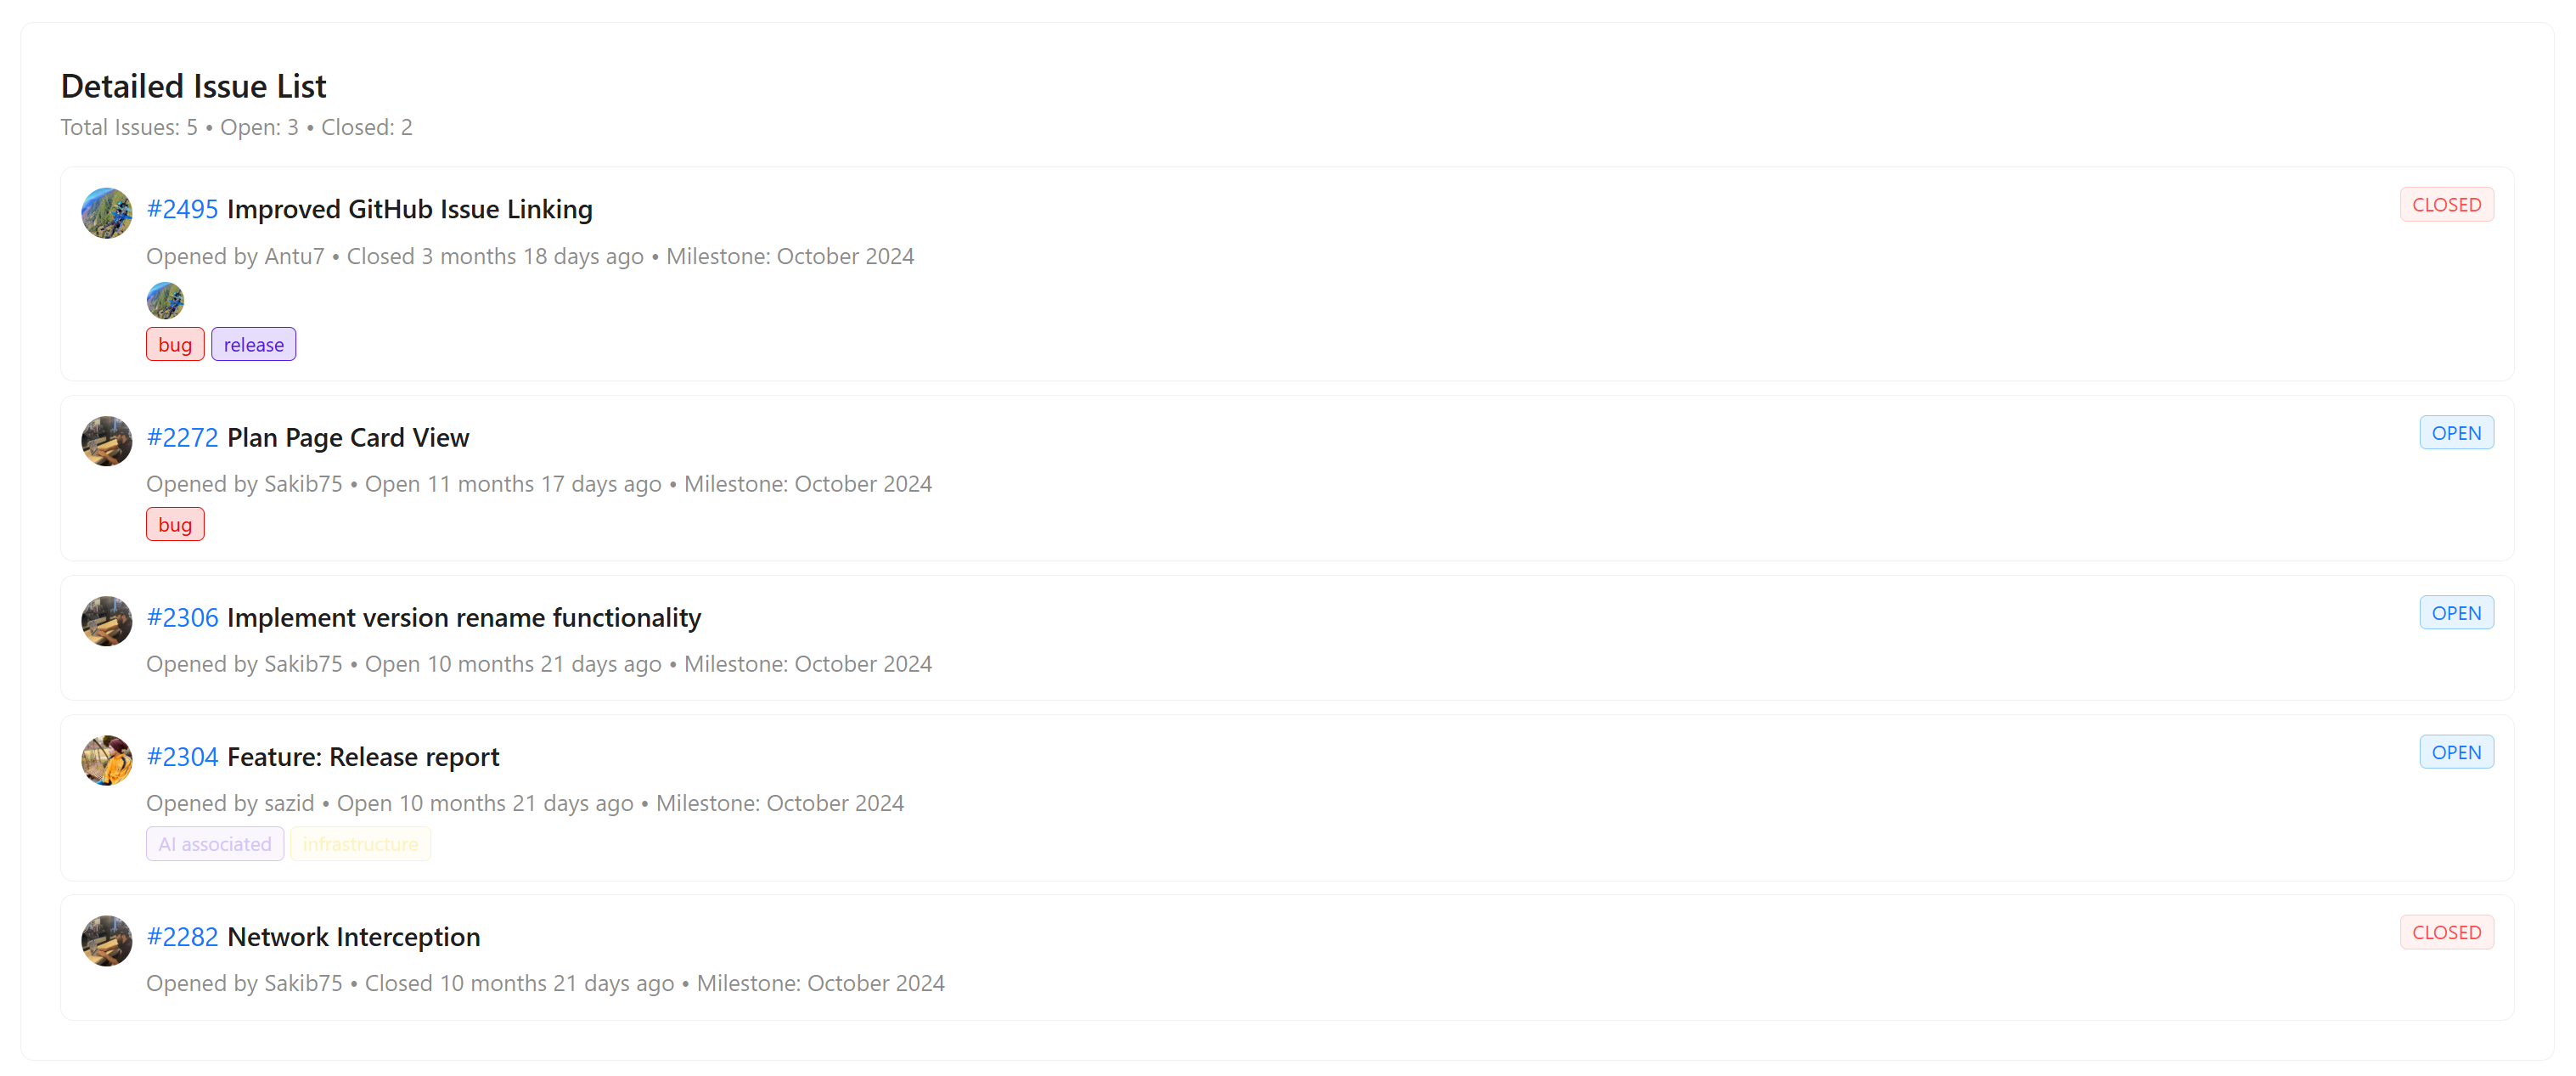
Detailed Issue List
This section display the list of GitHub issues, if any exist. Here, if there are more than five issues, a See All button will appear. It will also display when the issue was opened, when it was closed, and its priority level.
Security Vulnerabilities
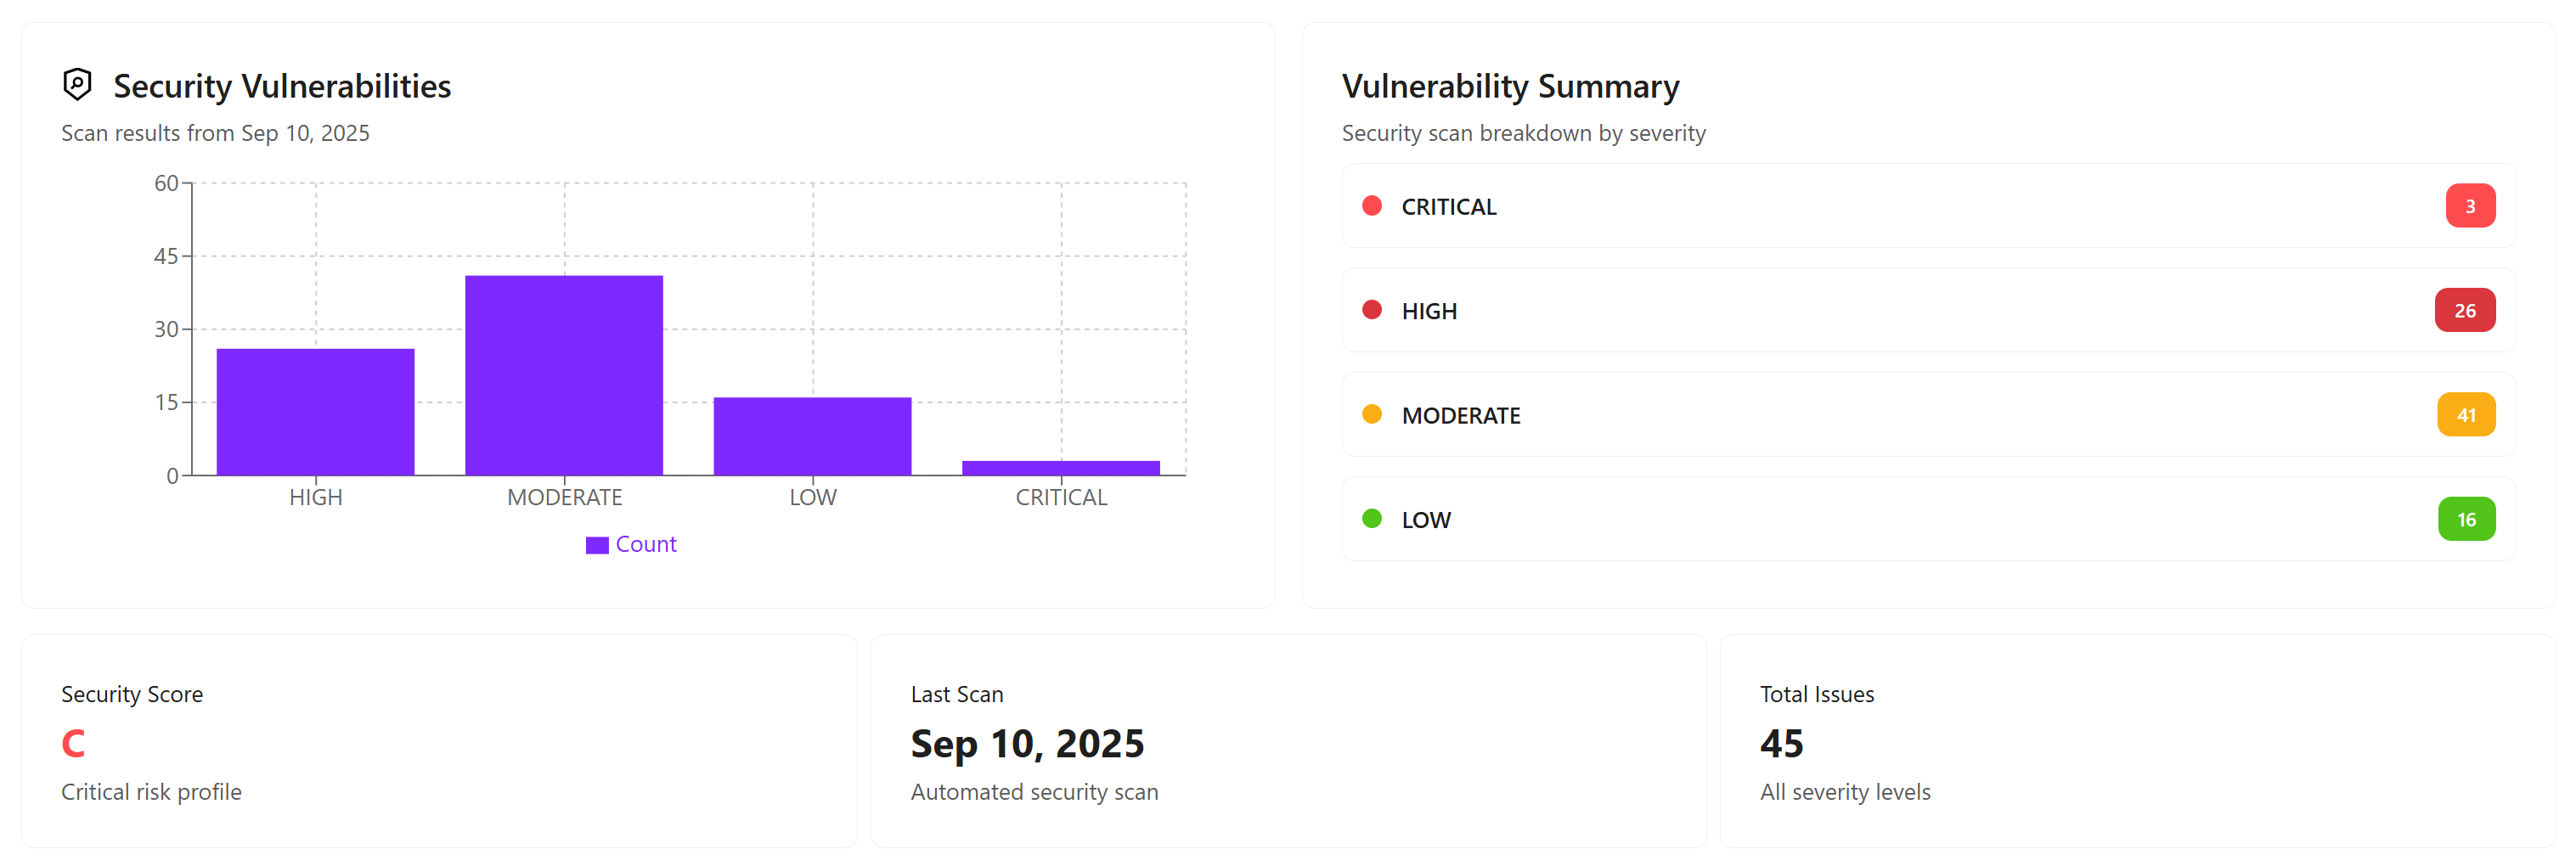
Security vulnerabilities are shown in the Security section of our GitHub, and they depend on the security settings. However, the chart shows the following information:
- Y-axis (Vertical): The number of vulnerabilities found (Count), ranging from 0 to 60.
- X-axis (Horizontal): The four categories of vulnerability severity: CRITICAL, HIGH, MODERATE, LOW.
- The Bars: Each bar's height represents the exact number of vulnerabilities found for that severity level. We can see:
- CRITICAL: Approximately 3 vulnerabilities.
- HIGH: Approximately 26 vulnerabilities.
- MODERATE: Approximately 41 vulnerabilities.
- LOW: Approximately 16 vulnerabilities.
Vulnerability Summary
Here, in the following image, the Vulnerability Summary report is showing that a security scan found 3 critical flaws, 26 high-severity issues, 41 moderate risks, and 16 low-level weaknesses, indicating the system requires immediate attention to address the most severe threats first.
However, all vulnerabilities are combined to generate a security score. For example, the current security score is C, which indicates a critical risk profile. It also shows the date of the last scan (Sep 10, 2025) and the total number of issues. At present, there are 45 issues, many of which are high-level.
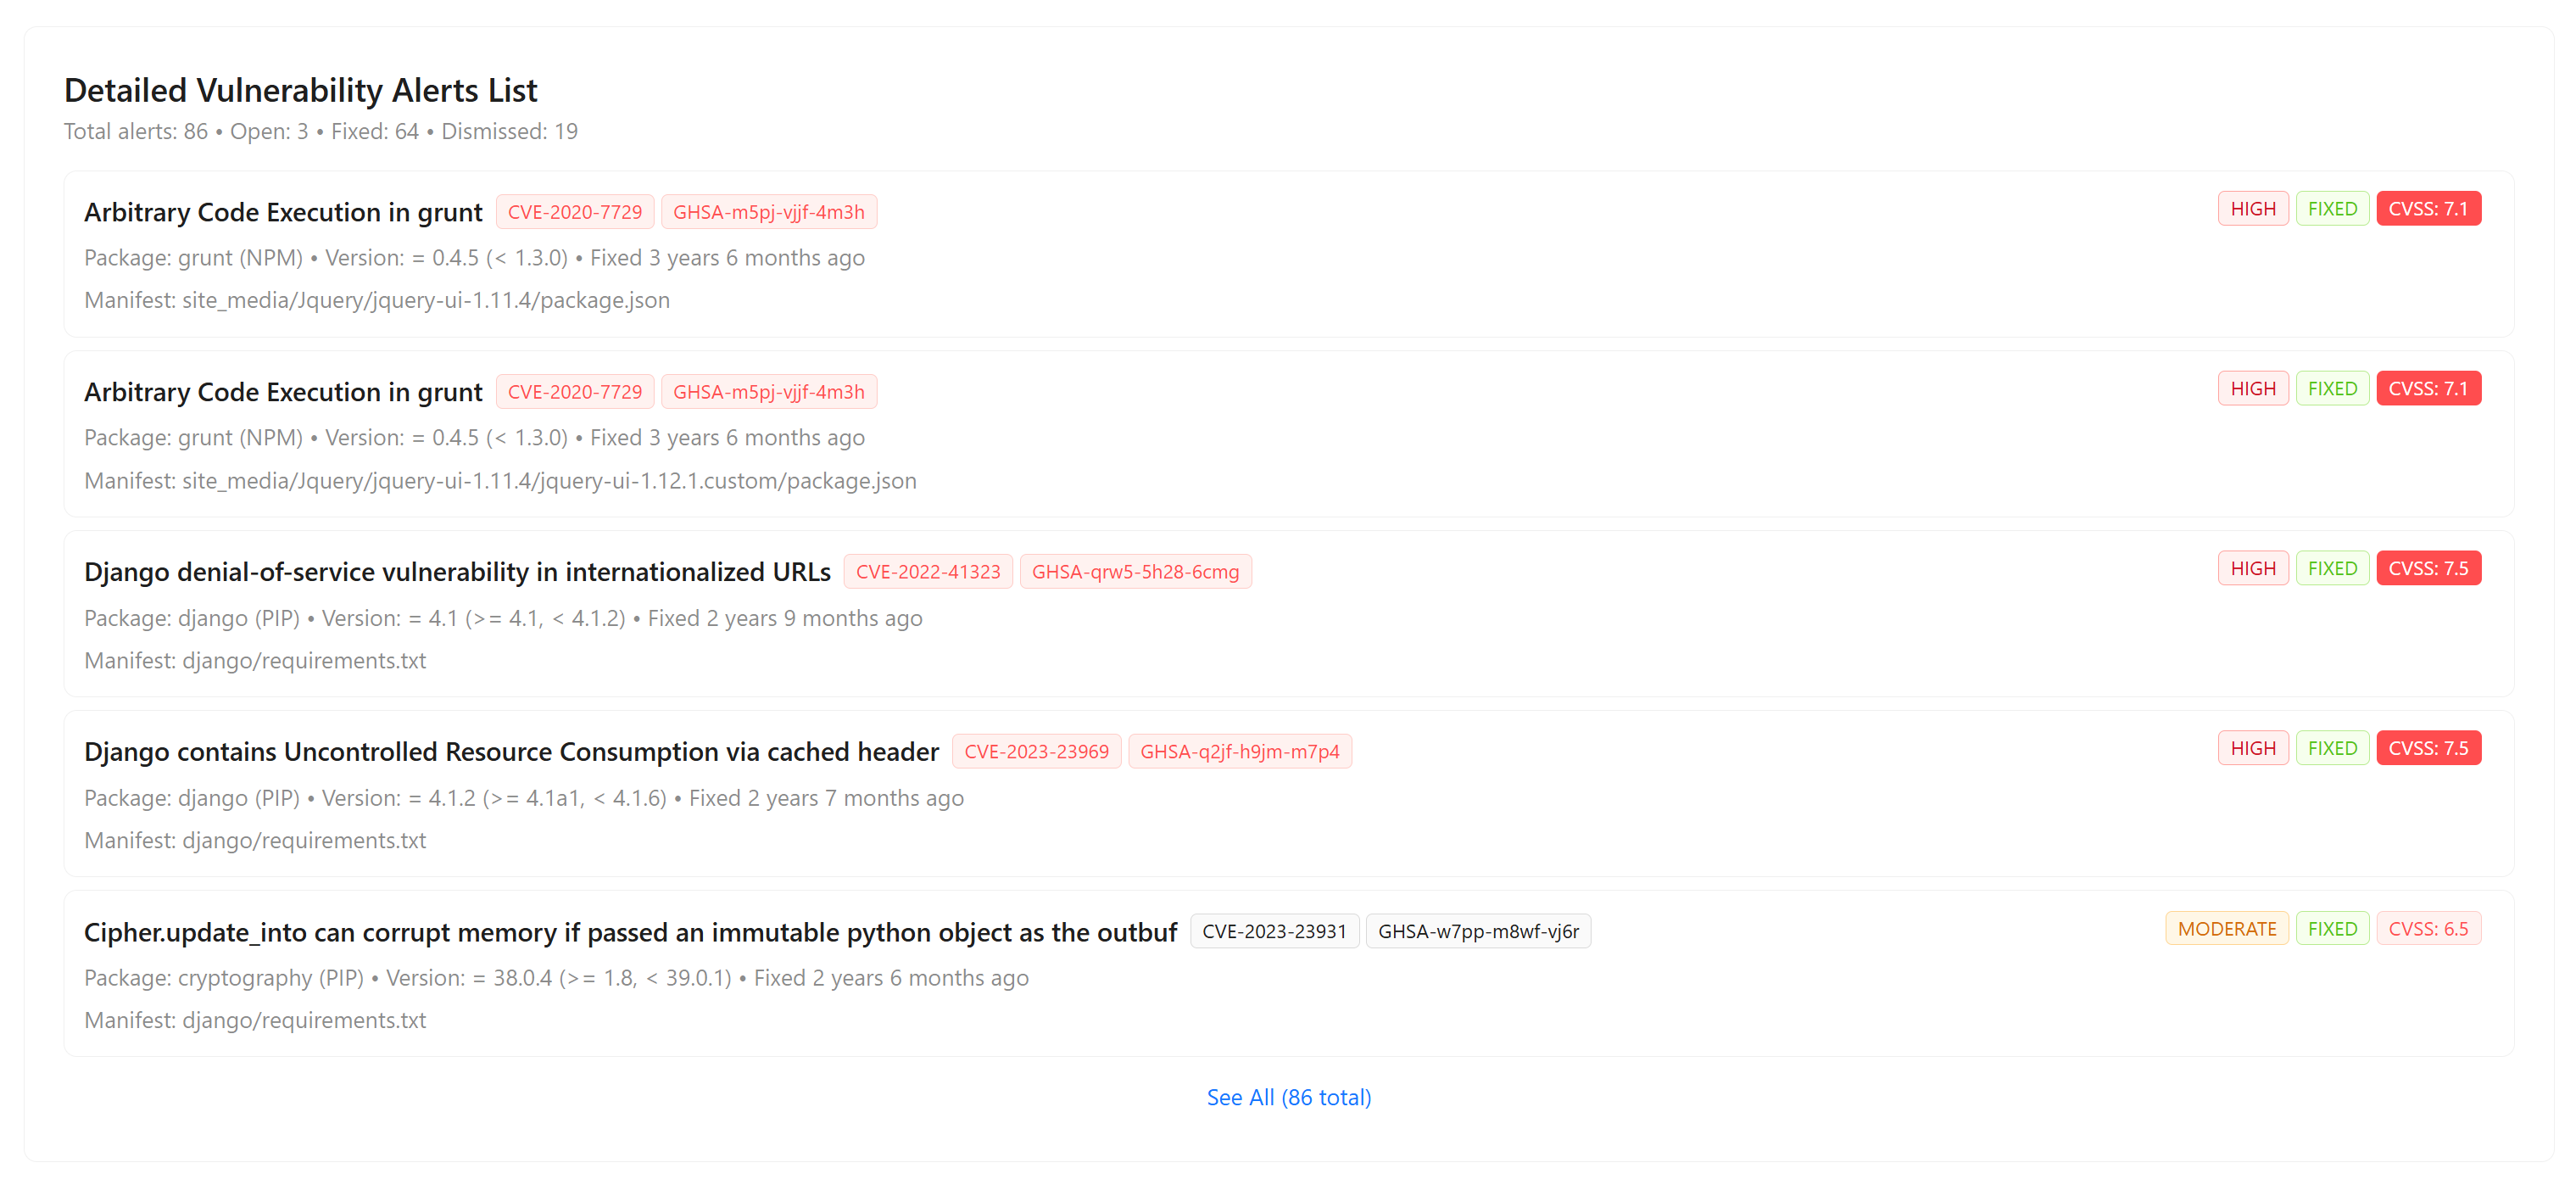
Detailed Vulnerability Alert List
Here is a detailed list of all security vulnerability alerts.
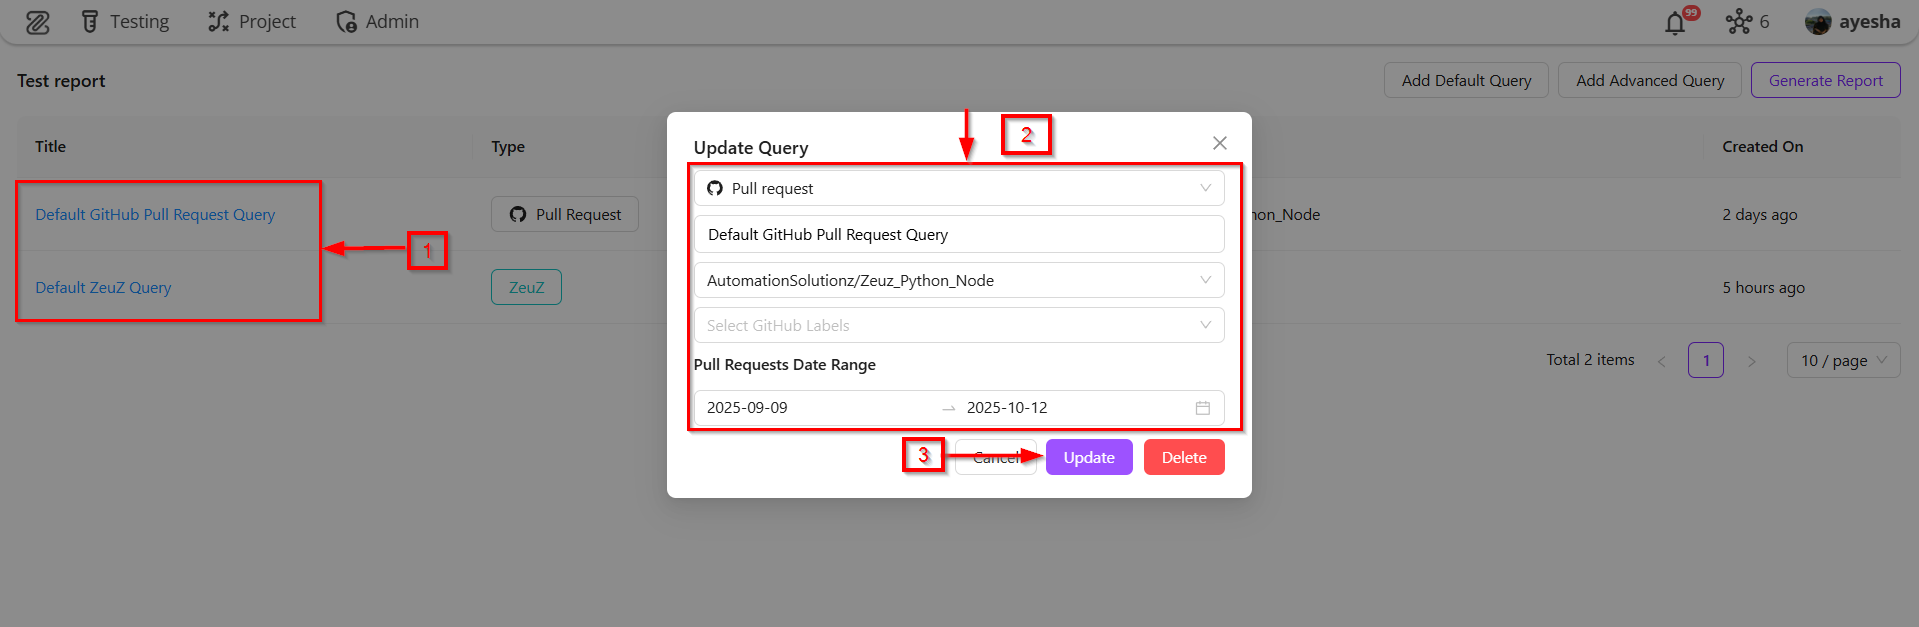
Update Query
If we want to edit the information of any report, we need to click on that specific report and update the required details if needed.
If the version does not contain any information, it will not display the testing summary, testing overview, detailed failed test cases, detailed pull request list, or detailed issue list.