Run ID Details
The Run ID page provides a comprehensive view of a specific test execution in ZeuZ. It displays key outcomes, detailed logs, execution breakdowns, and configuration metadata-all in one place to help QA teams quickly assess and manage test runs.
Key Features
- Centralized Visibility: Presents test results, logs, timelines, and configuration data on a single page for quick access.
- Clear Status Insights: Shows a breakdown of test outcomes (Passed, Failed, Blocked, Skipped, Submitted), helping teams gauge overall quality and progress.
- Prioritized Reporting: Offers visual breakdowns by priority and feature, enhancing on critical areas or modules under test.
- Actionable Controls: Includes buttons for rerunning tests, sending email reports, canceling runs, and switching UI versions, providing immediate control.
- Rich Contextual Data: Surfaces metadata like user, project name, execution environment, objective, milestone, timings, and history for full traceability.
- Interactive Filtering and Logs: Enables searching, filtering, and selecting test cases, and diving into executable steps with logs and screenshots.
Steps to navigate to the Run ID details page
- From the menu bar, go to the Testing option and select the History feature under Deployments.
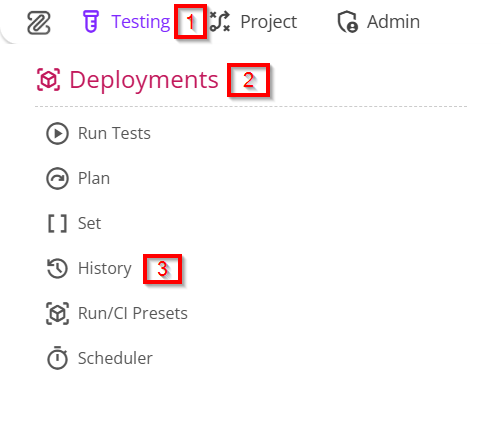
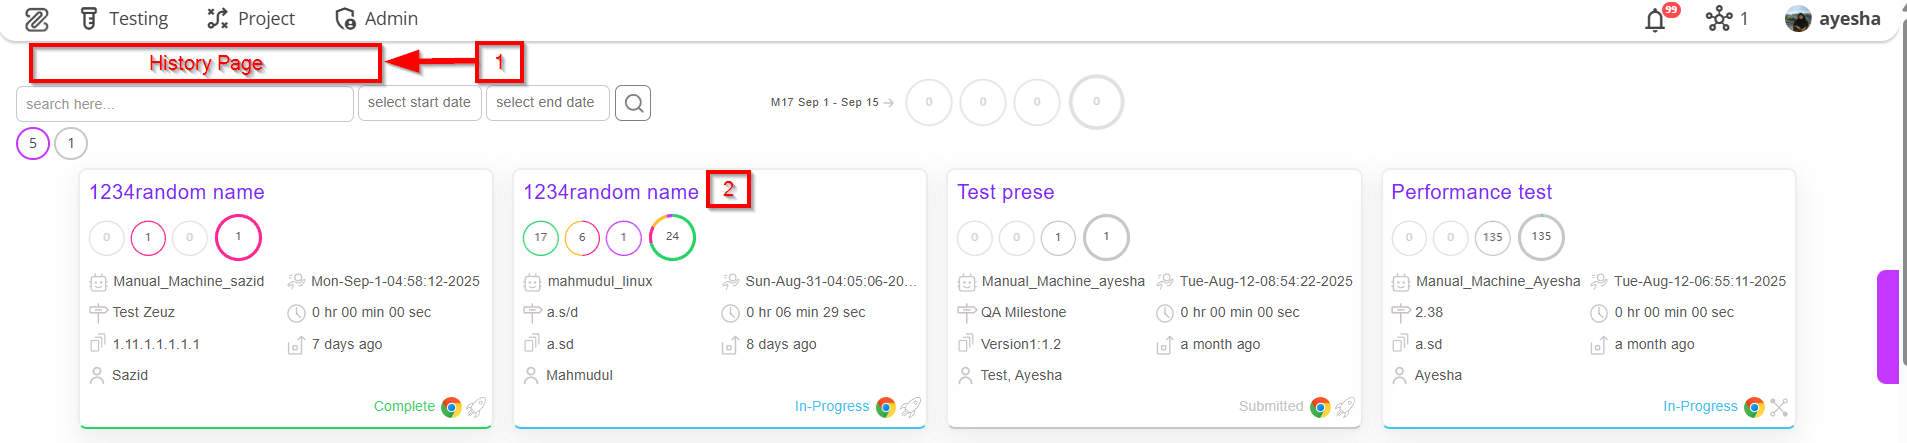
- Go to the History page.
- Click on a specific test case to view its Run ID details page.
Run ID Details Page
At the top right of the page, there are four types of buttons:
- Switch to old UI
- Rerun
- Cancel.
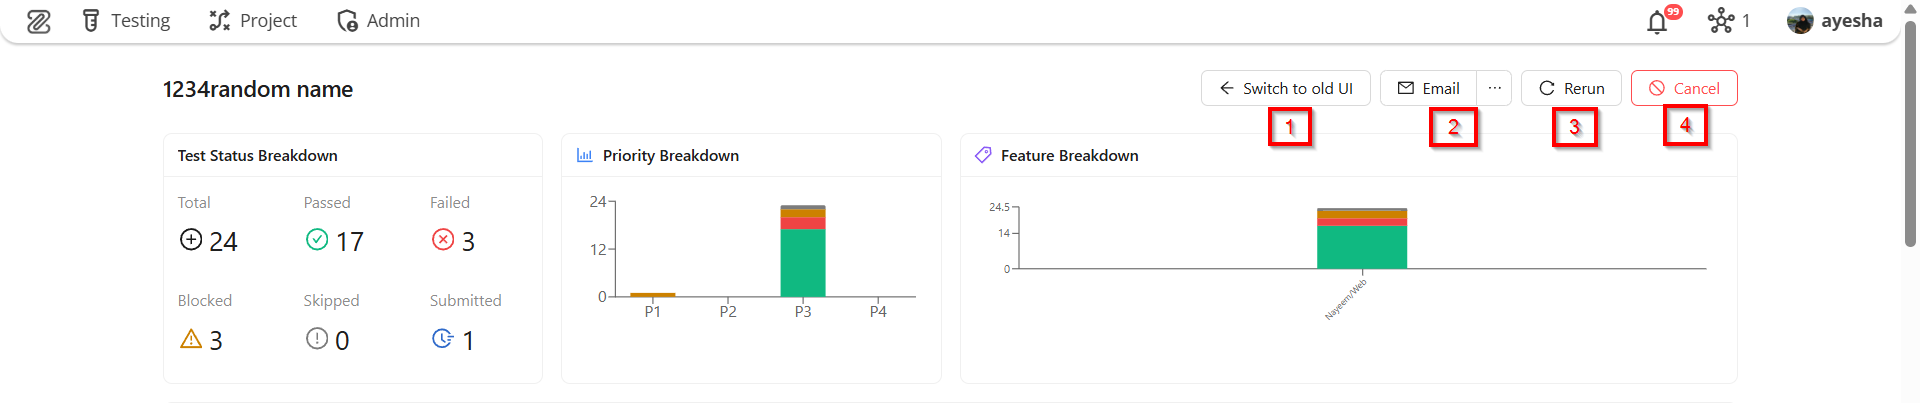
- Switch to old UI: Allows the user to view the same run history and execution details using the previous version of the user interface.
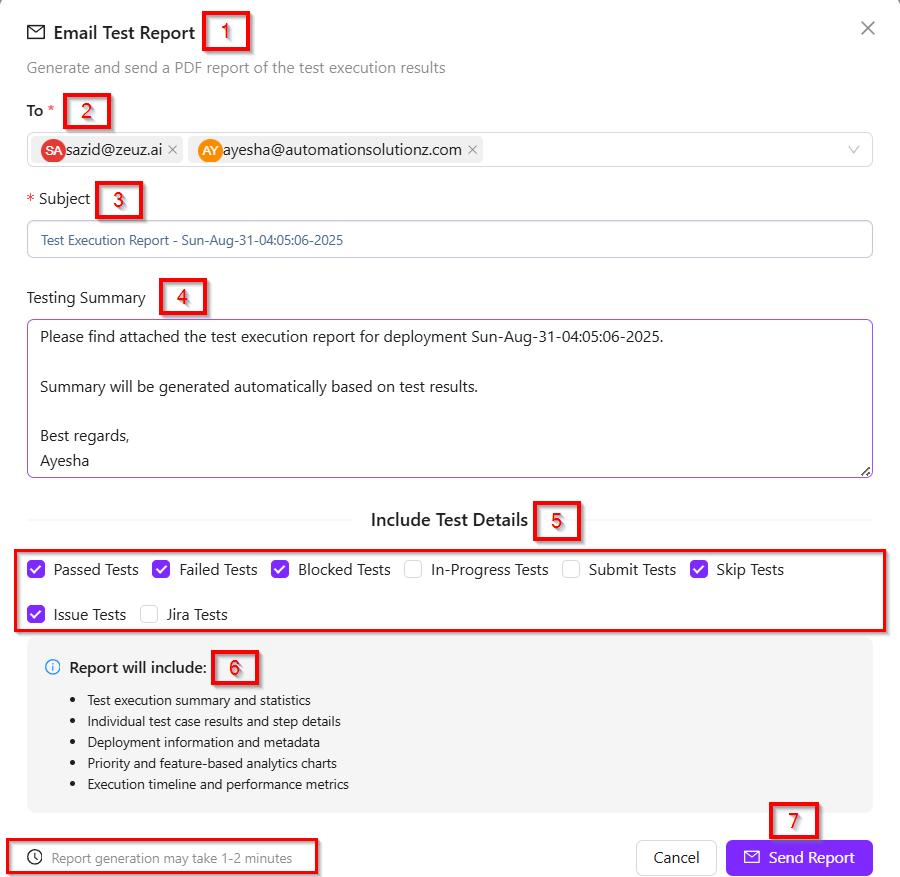
- Email: This feature enables a user (e.g., a QA lead or automation engineer) to configure and send a comprehensive report of test results to stakeholders.
- Email Test Report: This is the title of the feature, clearly stating its purpose: to generate a test report and send it via email.
- To: This is a required field (indicated by the asterisk
*) for specifying who will receive the report. Multiple addresses can also be selected. For example: sazid@zeuz.ai, ayesha@automationsolutionz.com. - Subject: It typically refers to the title or main description associated with that particular test run. The subject auto-generates with crucial information, such as: Test Execution Report - Sun-Aug-31-04:05:06-2025.
- Testing Summary: It provides a concise overview of the results and status of all tests executed in that specific run.
- Include Test Details: This title indicates the purpose: to select which test statuses (such as, Passed Tests, Failed Tests, In-progress Tests, Submit Tests, Skip Tests, Issue Tests, Jira Tests) are included in the final report. The user can check or uncheck each status as needed.
- Report will include: It includes the following details of a specific Run ID, such as:
- Test execution summary and statistics.
- Individual test case results and step details.
- Deployment information and metadata.
- Priority and feature-based analytics chart.
- Execution timeline and performance metrics.
- Send Report (button): Execute the generation and distribution of the report based on all the configured settings.
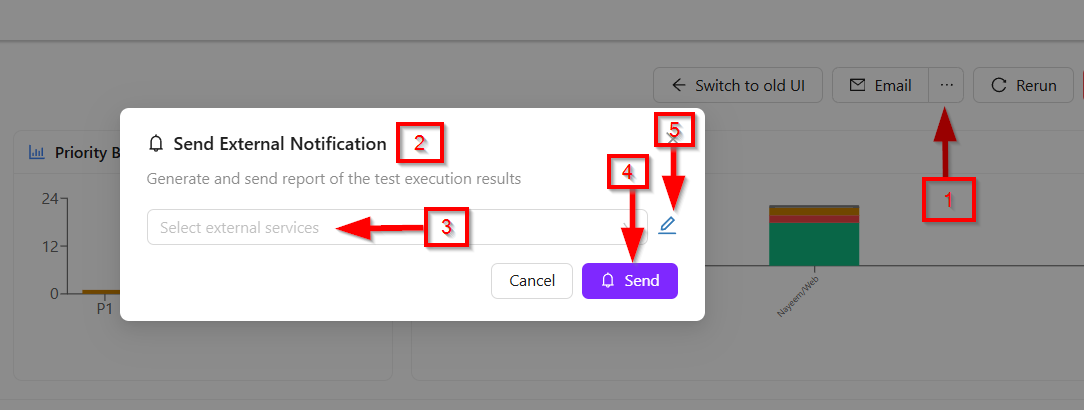
- Send External Notification: There is a Notify button along with the Email option. By clicking it, the Send External Notification window appears, through which a report of the test execution results can be generated and sent by selecting external services. If necessary, new external services can also be created by clicking the button available on its right side.
Report generation may take 1-2 minutes.
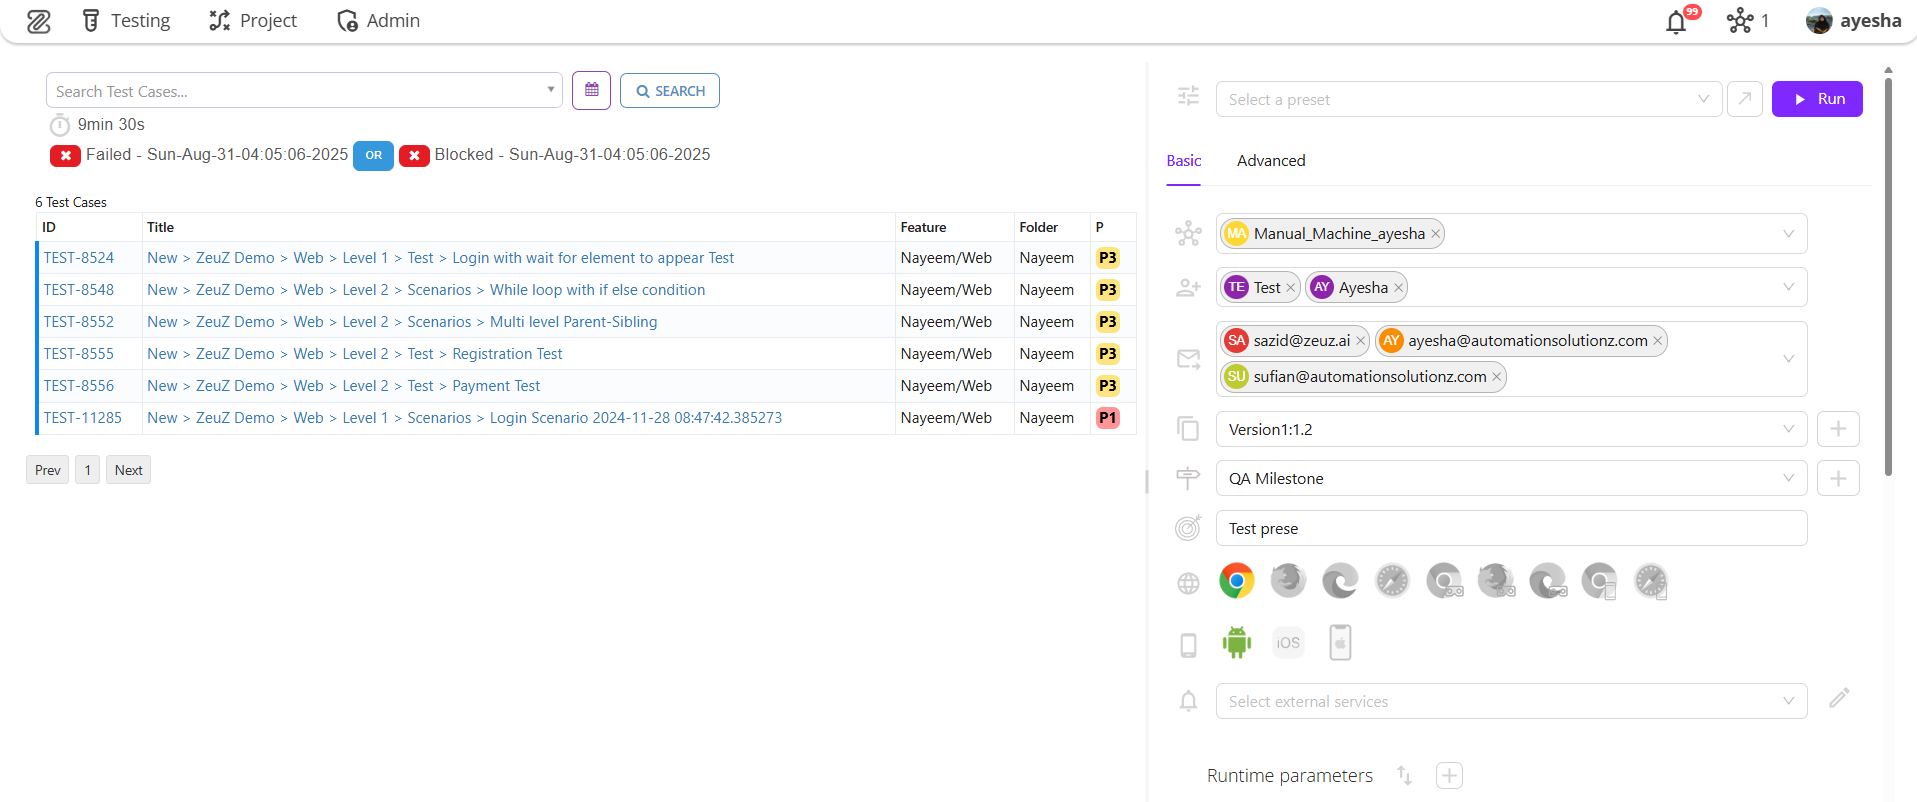
- Rerun: If we click the Rerun button, it redirects us to the Deploy Run page.
To learn how to deploy the test cases, click on the link below:
https://docs.zeuz.ai/docs/zeuz-server/testing/how-to-deploy-test-cases/
- Cancel: Clicking the cancel button will mark the specific Run ID as canceled.
Available details on the page
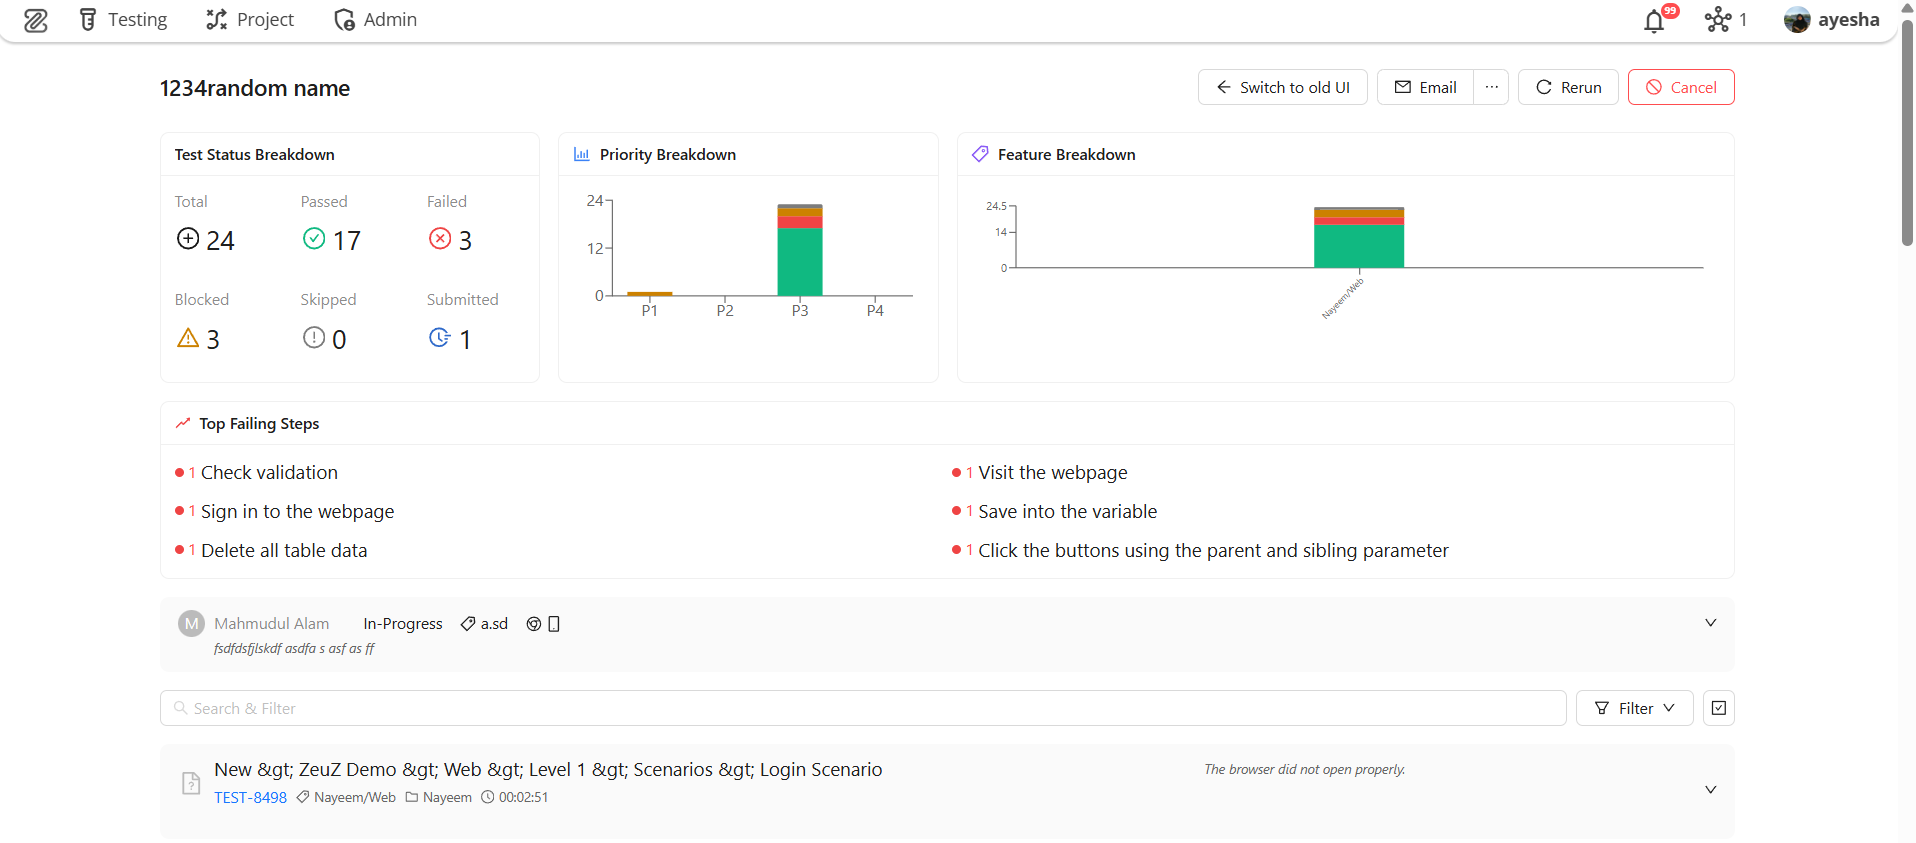
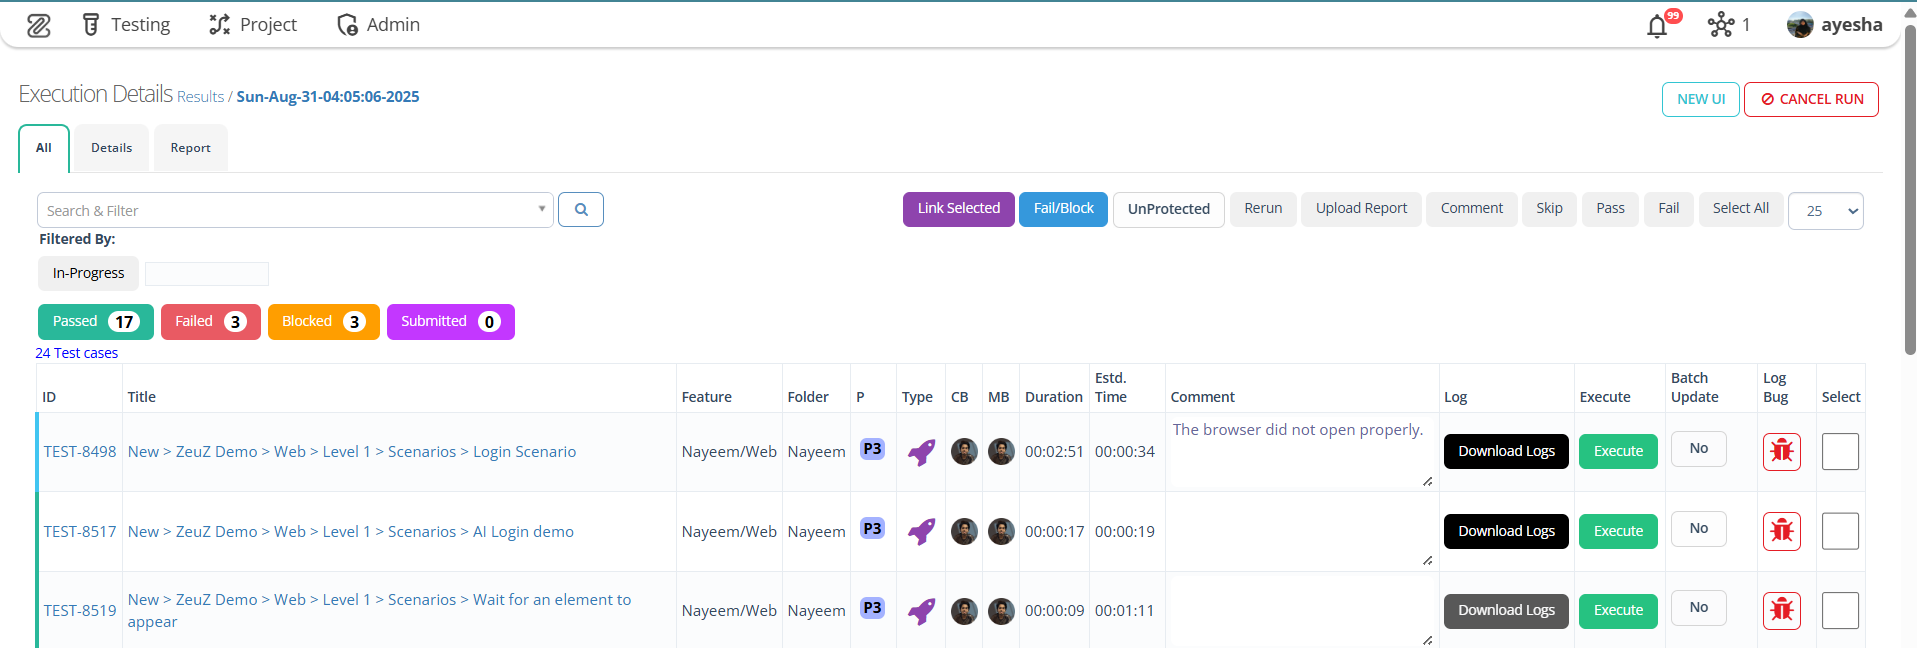
1. Test Status Breakdown
The option labeled Test Status Breakdown at the top left corner refers to a concise, visual overview that classifies a set of test cases or an entire test run according to their current execution outcomes. For Example:
- Total (24): This indicates that a total of 24 test cases were executed.
- Passed (17): Out of these, 17 test cases successfully passed without any issues.
- Failed (3): Three test cases did not meet the expected results and failed.
- Blocked (3): Three test cases could not be executed due to dependencies or restrictions, so they are marked as blocked.
- Skipped (0): No test cases were intentionally skipped in this run.
- Submitted (1): One test case has been submitted, meaning its result was recorded but not categorized under pass, fail, or block.
However, this breakdown offers a clear snapshot of the execution progress, using visual indicators like pass/fail counts and submission status to support prompt, data-driven decisions.

2. Priority Breakdown
Displays a bar chart that visually categorizes test cases within a particular test run according to their assigned priority level. However, in the following scenario:
- P1, P2, P3, P4: These indicate different test priority levels (P1 being the highest priority and P4 the lowest).
- The bar graph visually displays the execution status for each priority group.
Here, the tooltip highlights Priority P3, and the results are as follows:
- Passed (17): Seventeen test cases with P3 priority have successfully passed.
- Failed (3): Three P3 test cases failed.
- Blocked (2): Two P3 test cases were blocked due to dependencies or restrictions.
- Submitted (1): One P3 test case was submitted without being categorized as pass/fail.
- Skipped (0): No P3 test cases were skipped.

3. Feature Breakdown
It visually represents the status of tests associated with different features in a test run. For example, the chart visually displays the Status of executed test cases under the feature Nayeem/Web. It uses a horizontal stacked bar to indicate how many test cases fall into each status category. Here is a precise explanation:
-
X-axis (Features): The horizontal axis lists the names of the features or test categories. In the following example, the feature includes: Nayeem/Web.
-
Y-axis (Number of tests): The vertical axis shows the number of tests. The scale indicates how many tests are associated with a feature, ranging from 0 to roughly 24.5.
-
Bars: Each vertical bar represents the total tests in that feature. Hovering over the bar displays a breakdown of test outcomes.
-
Tooltip Breakdown (example for "Nayeem/Web" feature):
- Passed: 17
→ Shown in Green.
→ Indicates that 17 test cases ran successfully without issues. - Failed: 3
→ Shown in Red.
→ Represents 3 test cases that did not meet the expected outcome. - Blocked: 3
→ Shown in Orange.
→ Refers to test cases that could not be executed due to dependencies, environment issues, or other blockers. - Submitted: 1
→ Shown in grey (small section within the bar).
→ Means 1 test case has been submitted for execution but not yet finalized. - Skipped: 0
→ Shown in Blue (but here value is 0).
→ No test cases were intentionally skipped in this run.

- Passed: 17
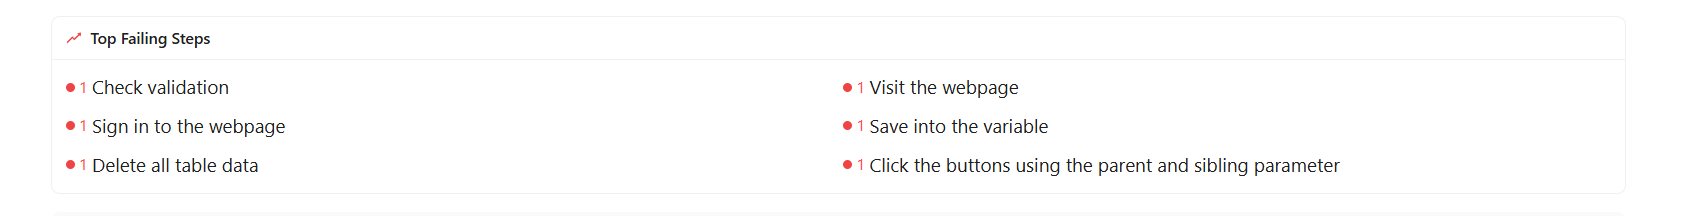
4. Top Failing Steps
This section lists the test steps that have failed most frequently during execution.
-
List of Failed Steps: Each bullet represents a failed action within different test cases:
-
Check validation – The validation check step failed once.
-
Sign in to the webpage – Login or authentication step failed once.
-
Delete all table data – Deleting records or clearing data from a table failed once.
-
Visit the webpage – Page navigation or loading failed once.
-
Save into the variable – Capturing/storing a value into a variable failed once.
-
Click the buttons using the parent and sibling parameter – A UI interaction with buttons (using parent/sibling locators) failed once.
-
-
Indicators (Red dots with “1”)
-
The red dot represents failure.
-
The number 1 indicates that each step failed once during execution.
-
Below the Top Failing Steps section, the basic details of a test run submission and the key metadata and configuration details of the specific test run are displayed. Here is a detailed explanation of each section:
- The user who executed or submitted the test run (e.g., "Mahmudul Alam").
- The current status of the test run (e.g., "In-progress" indicating that the test run has already started but is not yet completed).
- A tag or label assigned to the test run for identification or categorization purposes (e.g., "a.sd" ).
- The circular arrow with a gear icon represents the execution type or configuration used.
- Mobile/Device icon indicates that the test run involved mobile or device-related configurations.

- Execution Overview: It displays the key technical details of a test run. Here, it includes:
- Machine: Indicates the system or environment where the test was executed. In this case, it is mahmudul_linux meaning that the test was executed on a Linux-configured machine.
- Execution Time: Displays the total duration of the test execution. Here, it is 02:51:28, which means that the test execution time was 2 hours, 51 minutes, and 28 seconds.
- Machine IP: Shows the IP address of the machine used for execution. The IP is 127.0.0.1, which refers to the local machine (localhost).
- Dependencies: Lists the additional environments, tools, or platforms required for the test run. In this example, the dependencies are Browser: Chrome and Mobile: Android, indicating that the test was configured to run with Chrome browser and Android mobile environment.

- Configuration: It refers to the set of specific settings or parameters defined for a particular test run or project scenario in ZeuZ. In this context, the configuration includes:
- Version: The software or system version to be tested (e.g., "a.sd").
- Objective: The software or system version to be tested (e.g., "1234random name").
- Milestone: A specific project checkpoint or release version associated with this test (e.g., "a.s/d").

- Project Information: It refers to the basic identifying metadata that links a specific task to the larger project and team it belongs to. It includes:
- Project: This header indicates that the field below specifies the project name (e.g., "PROJ-17 - ZeuZ").
- Team: This header indicates that the field below it specifies the team responsible (e.g., "ZeuZ QA").

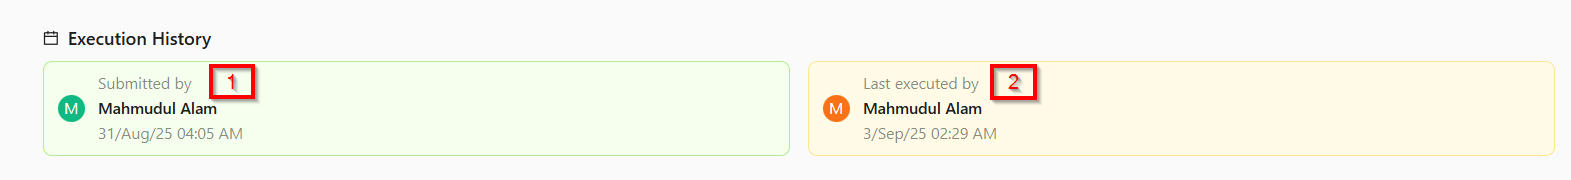
- Execution History: It refers to the record of previous runs for a specific test, task or automation script. It includes:
- Submitted By: This is the user who started this specific execution. They are the ones who requested the test run to begin (e.g., "Mahmudul Alam 31/Aug/25 04:05 AM").
- Last executed by: This field indicates who performed the execution if it was a manual test. In this case, "Mahmudul Alam last ran this task on September 3, 2025, at 2:29 AM."
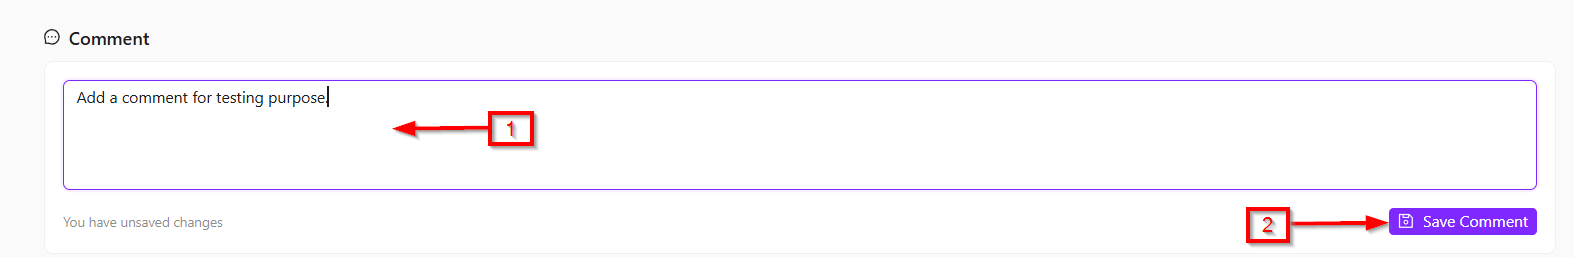
- Comment: Here, there is an option to add comments if desired. Whenever any changes are made, a Save Comment button will appear. If no changes are made, the button will not be visible. Once changes are made, the comment can be saved accordingly.
5. Search & Filter and Select Test cases options
- Search & Filter: There is a search and filter option through which we can search using the following criteria:
- Folder
- Feature
- Custom Tag
- Test step
- Status
- Type
- Set
- Test Case Version
- Only Folder.
- Filter: It means narrowing down the search results based on the current condition or outcome of a test case or test run. For example, in ZeuZ, one can filter tests to view only those that are Passed, Failed, Blocked, Skipped, or Submitted.
- Select Test Cases: It means choosing one or more specific test cases from a list for a particular action.If we want to select a test case, an option will appear next to the test cases from where we can make the selection.
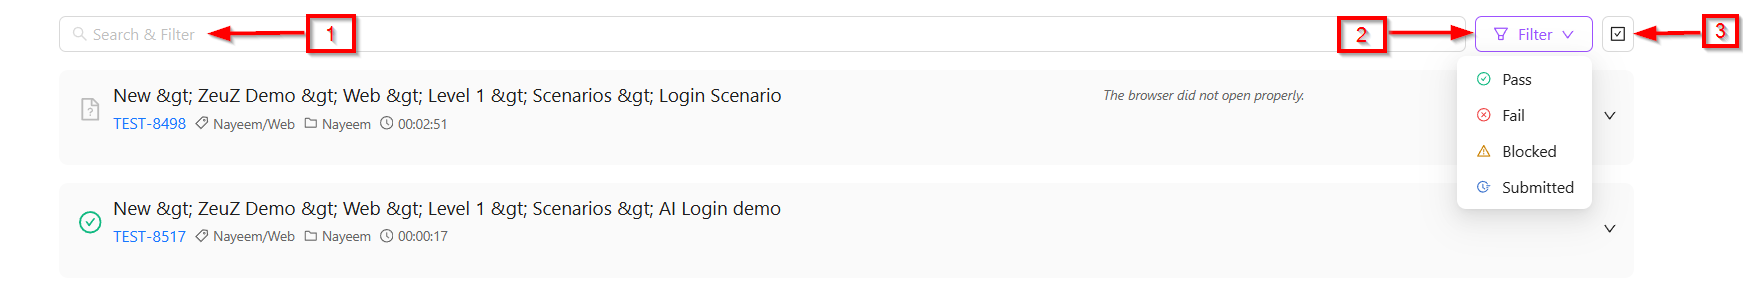
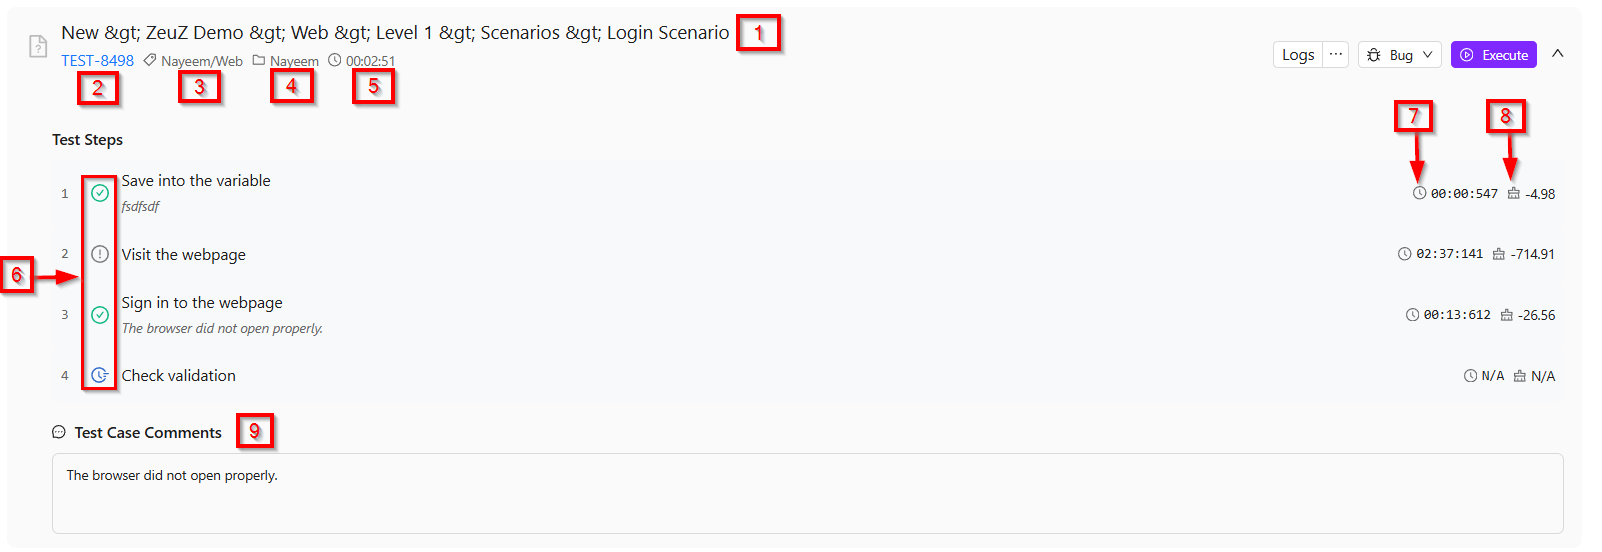
By clicking on a specific test case, we can view its details. Also, if we click on a specific test case, the test steps for that test case appear. Clicking the button on the left side will display the status, such as Passed, Failed, Skipped, Submitted, or Blocked. Clicking on this button will allow you to change the Status of the test step. Additionally, a comment can be added to each step. To add a comment, simply hover over the step to see the click option, enter the comment, and press the Save button, which will save it automatically. On the right side, it shows the execution time of that step: "00:00:547" and the memory usage: "-4.98". Howerver, from the given image, we get the following information:
- For “New > ZeuZ Demo > Web > Level 1 > Scenarios > Login Scenario”, there is an icon on the left side that indicates the status of that particular test case.
- The arrow available at the right side of that specific test case indicates that the item is clickable and expandable for more test case details.
- "Nayeem/Web" represents tags or labels attached to that particular test case.
- "Nayeem" is likely the name of a test suite, module, or folder where this test case is located.
- "00:02:51" it shows the execution time of that specific test case.
6. Other options related to the specific test case
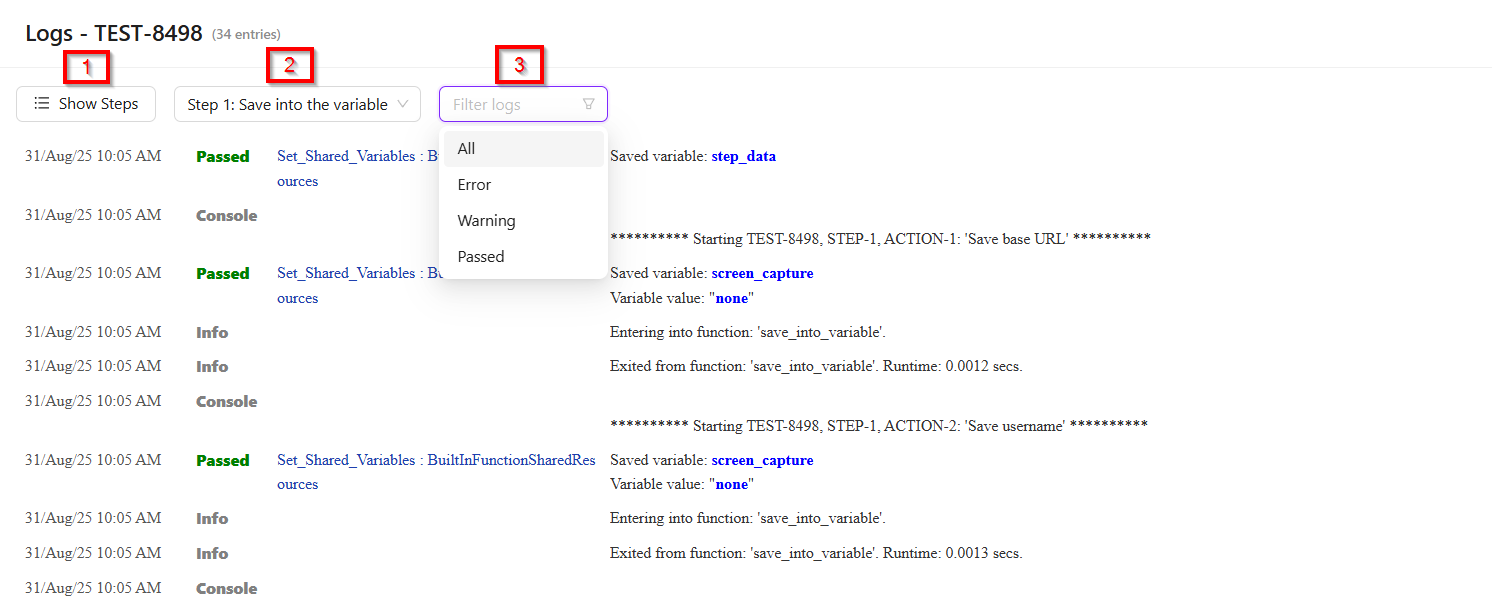
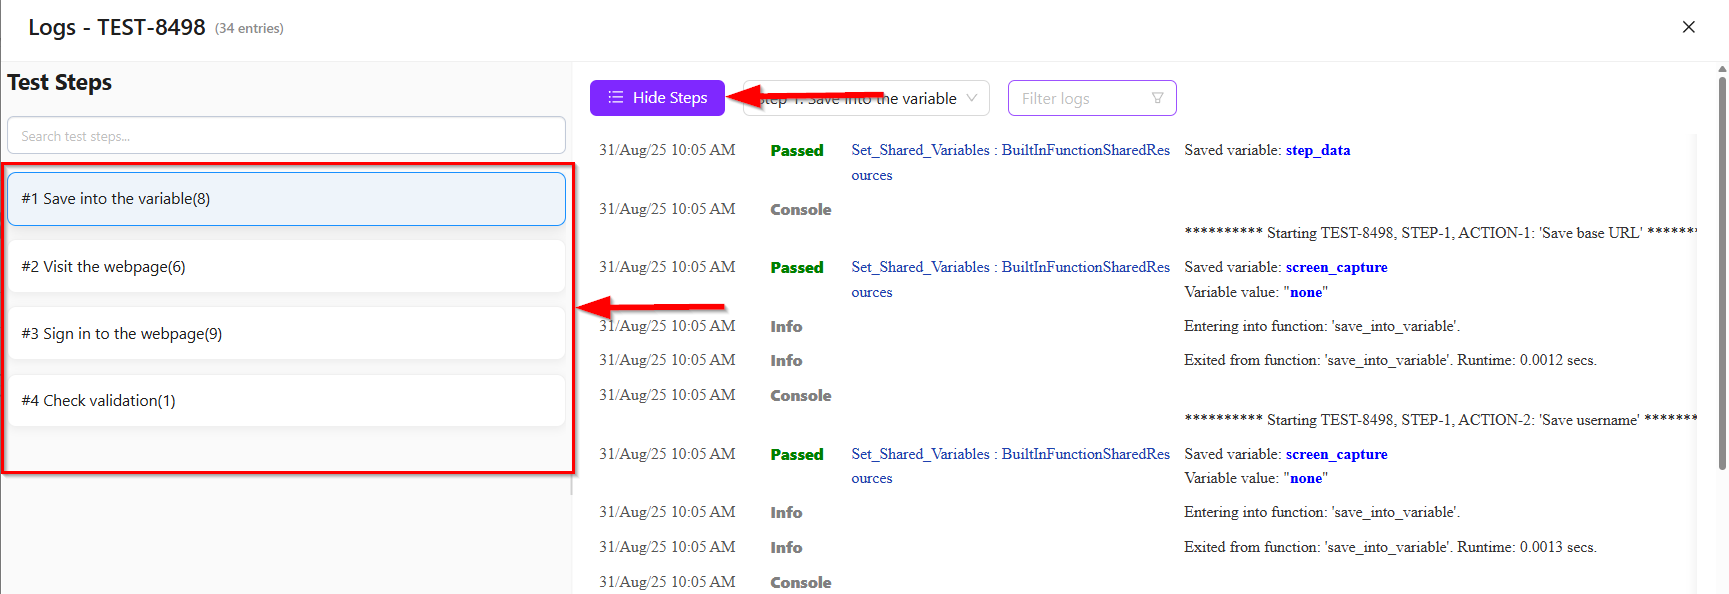
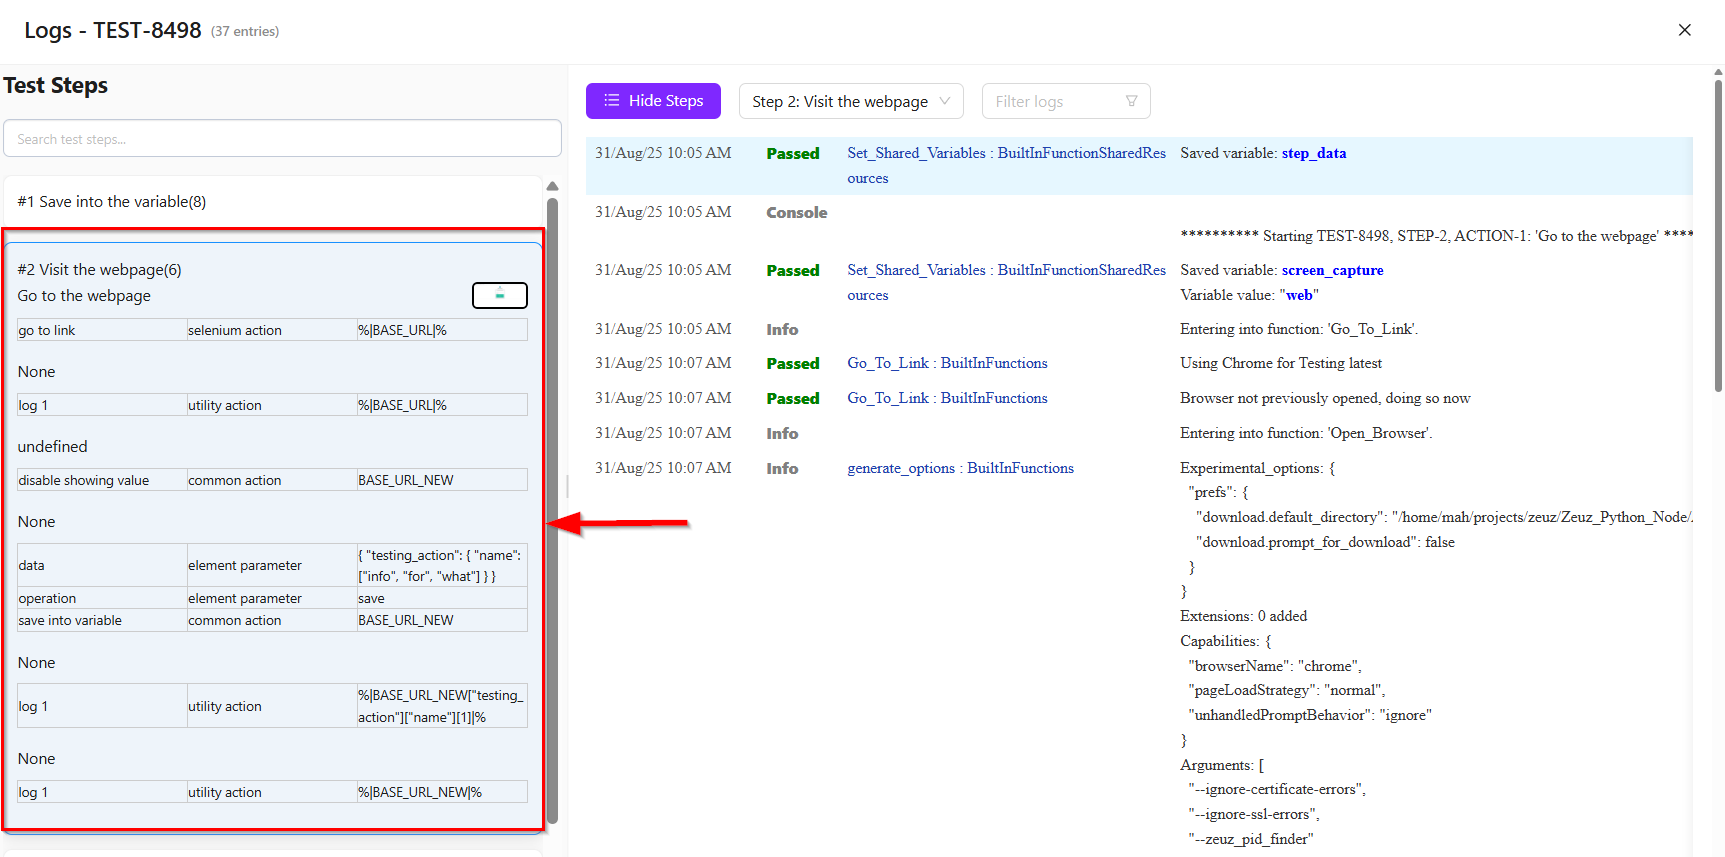
- Logs and Step Details: The Logs section displays detailed execution records for a specific test case. It has been improved with a modern, interactive view to make debugging faster and easier. From here, clicking the Logs button will display the logs for that test case. It has three options: "Show Steps", which displays the steps of the specific test case; a "Test Step Selector", which by default shows the first step but allows selecting another step if needed; and a "Filter" option, which lets us filter by All, Error, Warning, or Passed. However, in the Logs, clicking on "Show Steps" displays the list of steps. Clicking on the "Step List" displays the list of actions, and if an action contains a screenshot, it will also be shown. Users can drag the divider between the "Steps" and "Logs" panels to give more space to the logs for deeper analysis.
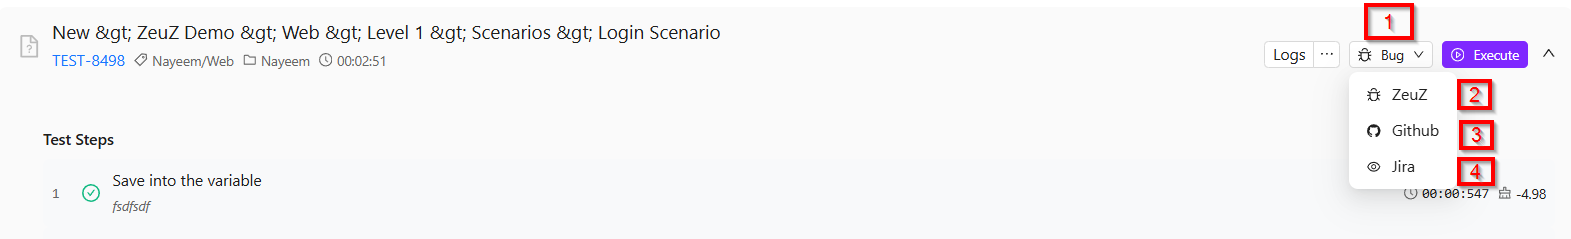
- Bug: By clicking the Bug option, three choices appear: ZeuZ, GitHub, and Jira. Clicking ZeuZ redirects us to its Create/Edit Bug page. Selecting GitHub allows us to create a GitHub issue by choosing a repository. Similarly, selecting Jira lets us create a Jira issue by choosing a Jira project.
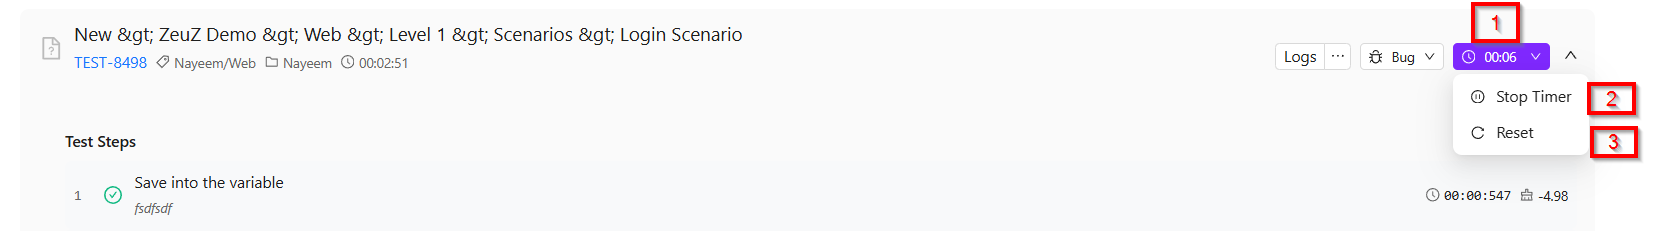
- Execute: If we want to execute a test case, we can simply click the Execute button. This will start a timer, which we can start, resume, or stop, ultimately showing us how much time it takes to execute the test case. If we change the status of any step, the timer for that step will automatically reset.
Summary
The Run ID page provides a detailed view of a specific test execution. It displays the overall status of the run (such as passed, failed, blocked, skipped, or submitted), along with execution metadata and configuration details. Users can view the breakdown of test cases, monitor top failing steps, access execution logs, and explore step-by-step actions with screenshots if available. This page helps teams track execution progress, identify issues quickly, and analyze test results effectively.