Automatability
The Automatability Report page provides a clear and comprehensive overview of a project’s automation status by combining key metrics, visual insights, and detailed breakdowns. Stat cards summarize total test cases, automation rate (the percentage of fully automated test cases), automated test cases, and automation potential (including easy and hard to automate tests), while the Category Distribution pie chart displays how test cases are distributed across the six automation categories—Automated, Easy to Automate, Hard to Automate, Not Automatable, Performance, and Undefined.
Automation Velocity tracks automation progress over time, showing a 12-month trend by default (from the current month back 12 months), and automatically adjusts to reflect the selected milestone’s start and end dates.
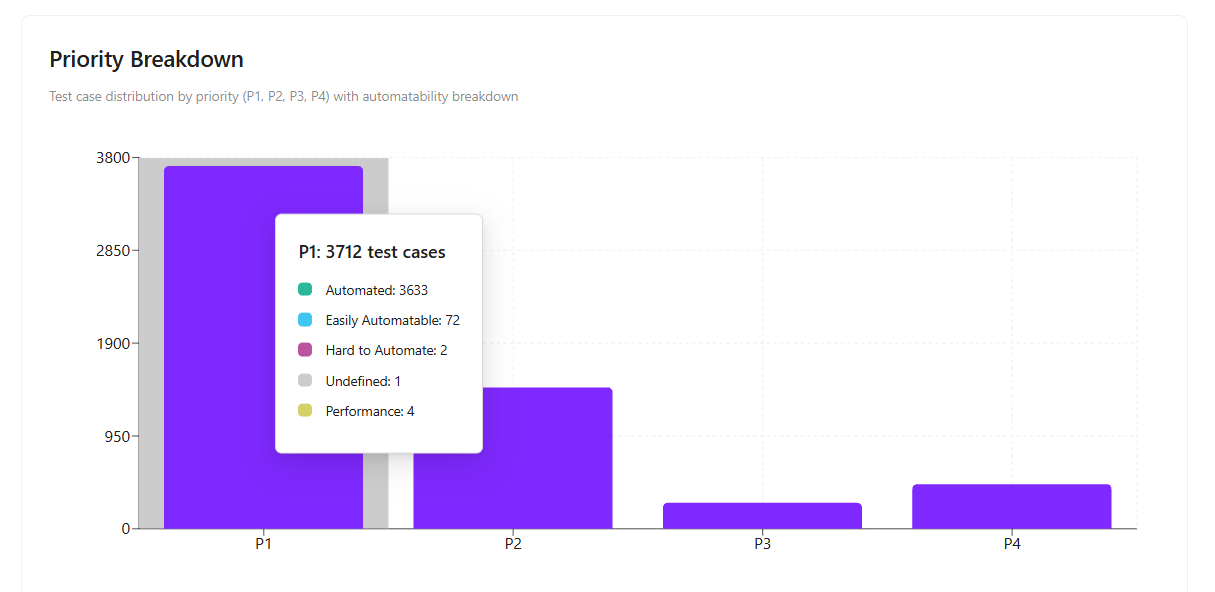
The Priority Breakdown highlights how test cases are distributed across priorities (P1, P2, P3, P4) along with their automation categories, helping teams assess whether high-priority tests are sufficiently automated.
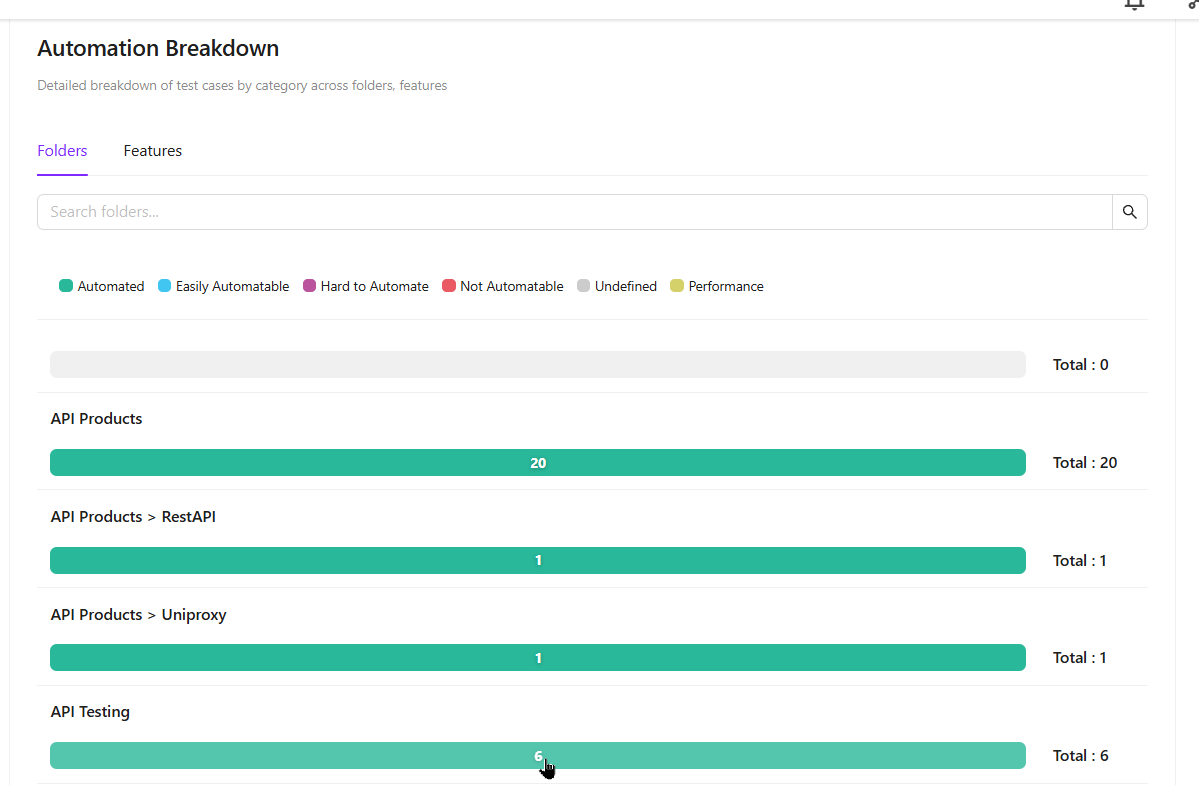
The Automation Breakdown shows folder- or feature-level counts and their automation category distribution—for example, DataPartitions may have 6 automated and 1 easily automatable test case. Additionally, all data on the page can be filtered by folder, feature, or milestone for more focused and detailed analysis.
Why it matters / Use Cases:
- Overall Automation Visibility: Shows the progress of automated test cases compared to the total number of manual test cases.
- Automation Planning and Categorization: Supports better automation planning by identifying automated, easily automatable, hard-to-automate, not automatable, undefined and performance test cases.
- Automation Progress Tracking: Enables tracking of automation progress over time through Automation Velocity trends.
- Priority-Based Automation Focus: Assists in prioritizing automation efforts by highlighting automation coverage for high-priority (P1–P4) test cases.
- Identification of Automation Gaps by Folder or Feature: Allows teams to identify automation gaps at the folder or feature level for targeted improvements.
- Milestone Readiness Analysis: Supports milestone-based analysis to evaluate automation readiness for upcoming releases.
Prerequisites
- Access to ZeuZ Server with permissions for Testing → Reports → Automatability.
- Test cases should have defined automation categories (Automated, Easy to Automate, Hard to Automate, Not Automatable, Performance, Undefined).
- Test cases should have assigned priority levels (P1–P4) for accurate Priority Breakdown analysis.
- Test cases should be organized into proper folders and features to enable Automation Breakdown and filtering.
- The automation status of test cases must be tracked to calculate automation rate, progress, and potential.
Features
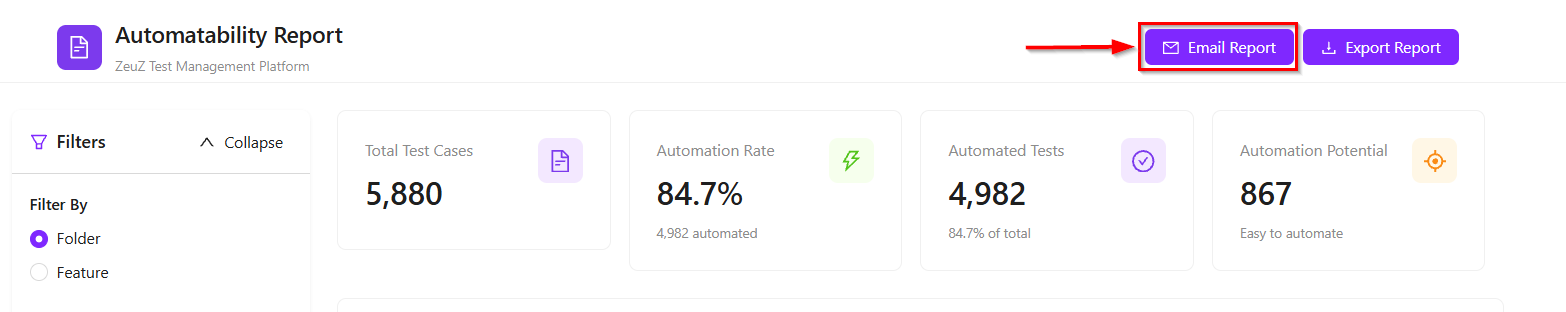
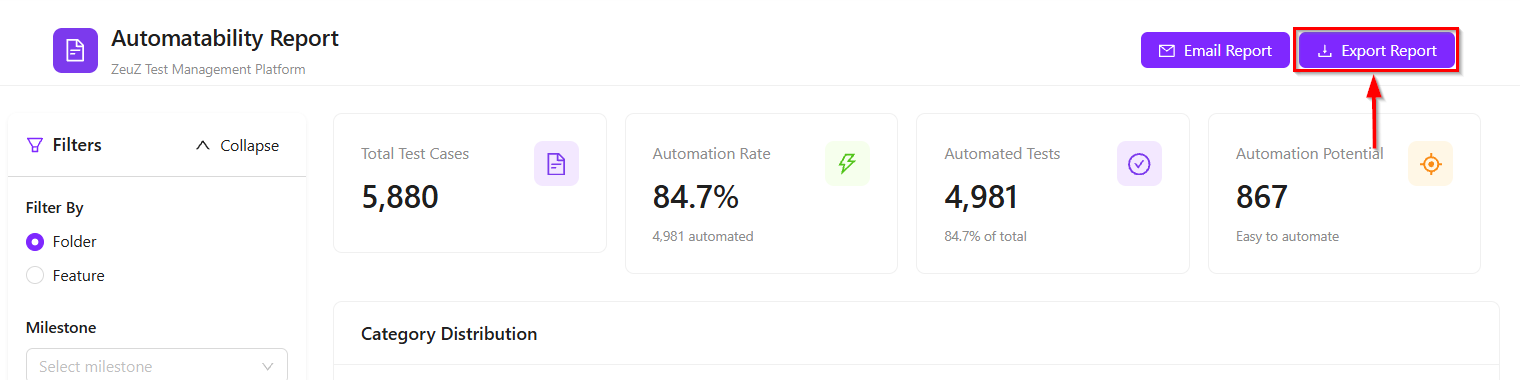
Stat cards
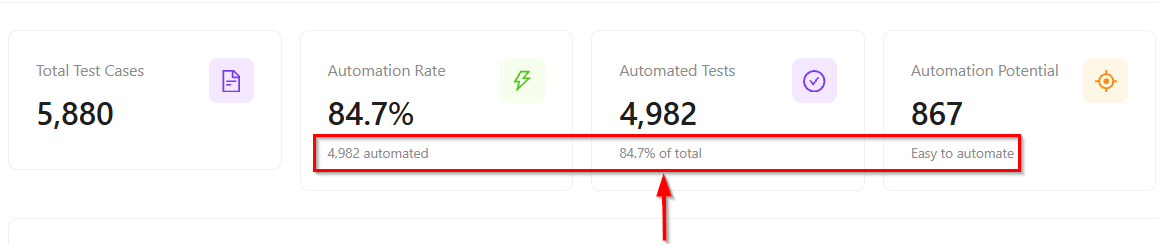
- The Stat cards summarize the total number of test cases, the automation rate (percentage of fully automated test cases), the count of automated test cases, and the automation potential, including both easy and hard-to-automate tests. It displays the following information:
- Total Test Cases (5,880): This represents the complete number of test cases available in the project, including both manual and automated ones.
- Automation Rate (84.7%): It shows the percentage of automated test cases out of the total number of test cases.
- Automated Tests (4,982): This shows the exact number of test cases that are currently automated. It directly contributes to the automation rate.
- Automation Potential (867): It highlights the test cases that are easy to automate.
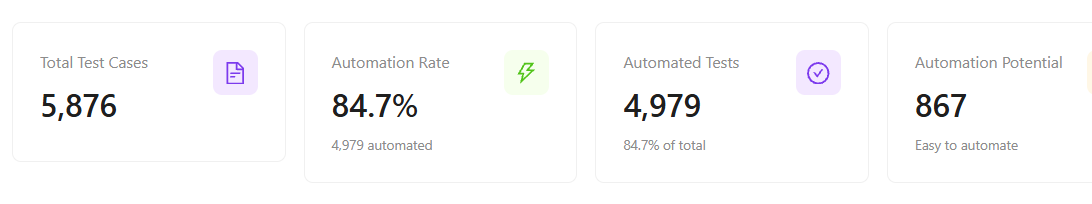
The information is clearly shown as a subtitle under the stat card to avoid any confusion and to help users understand the data correctly.
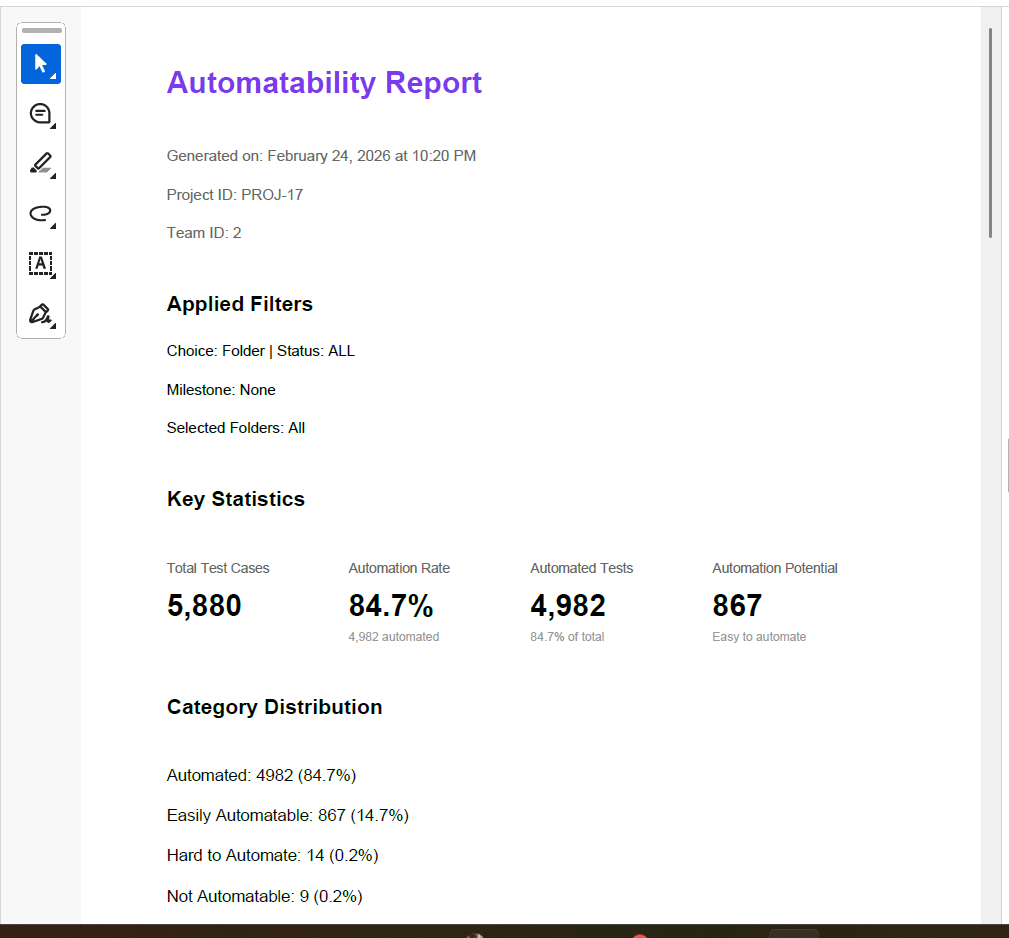
Category distribution
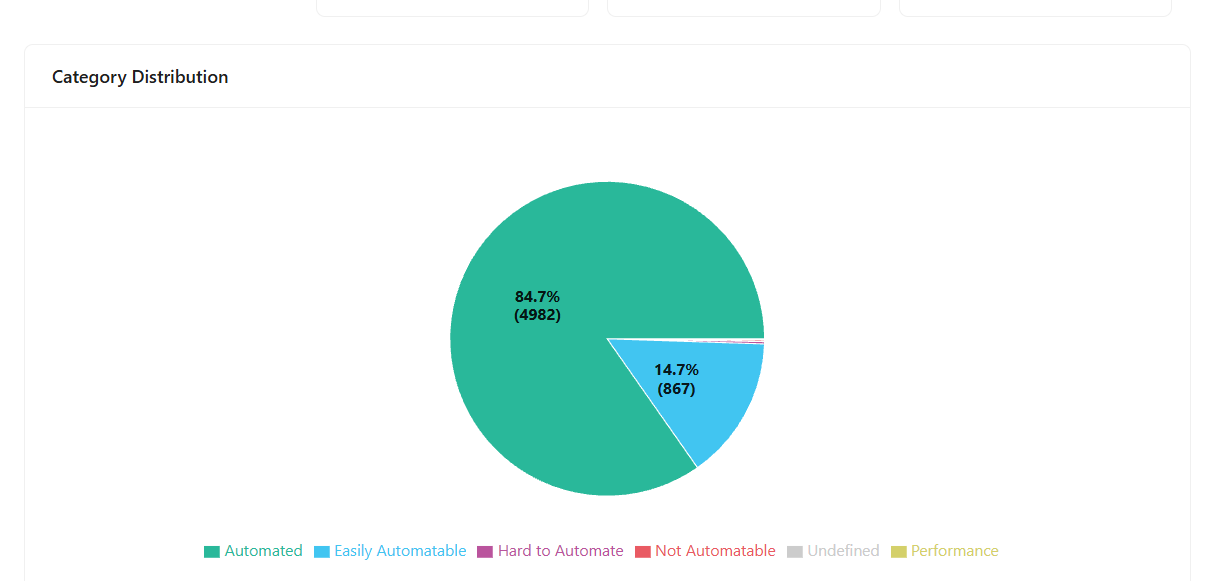
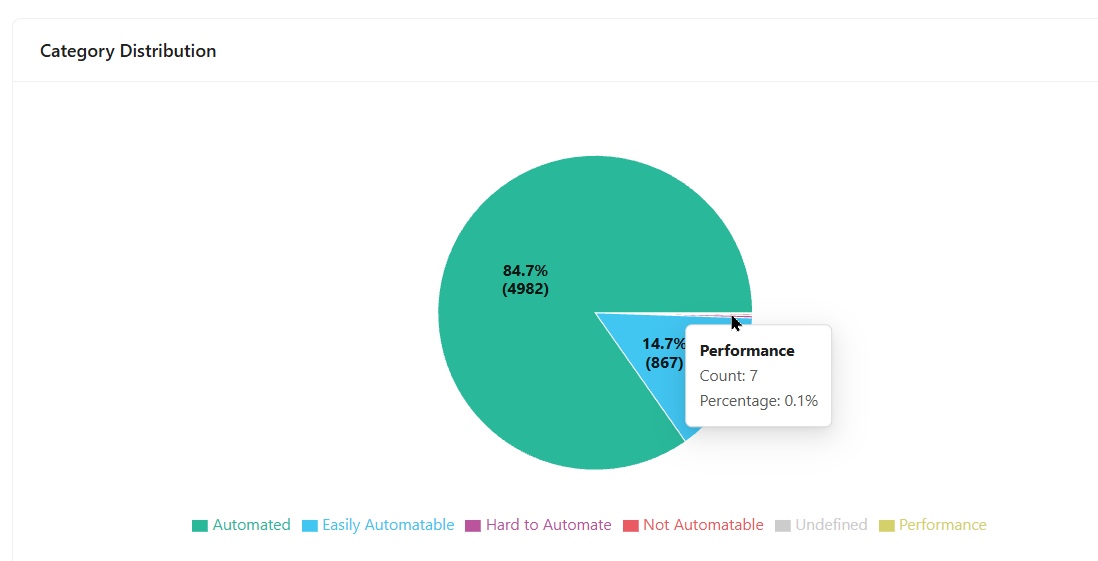
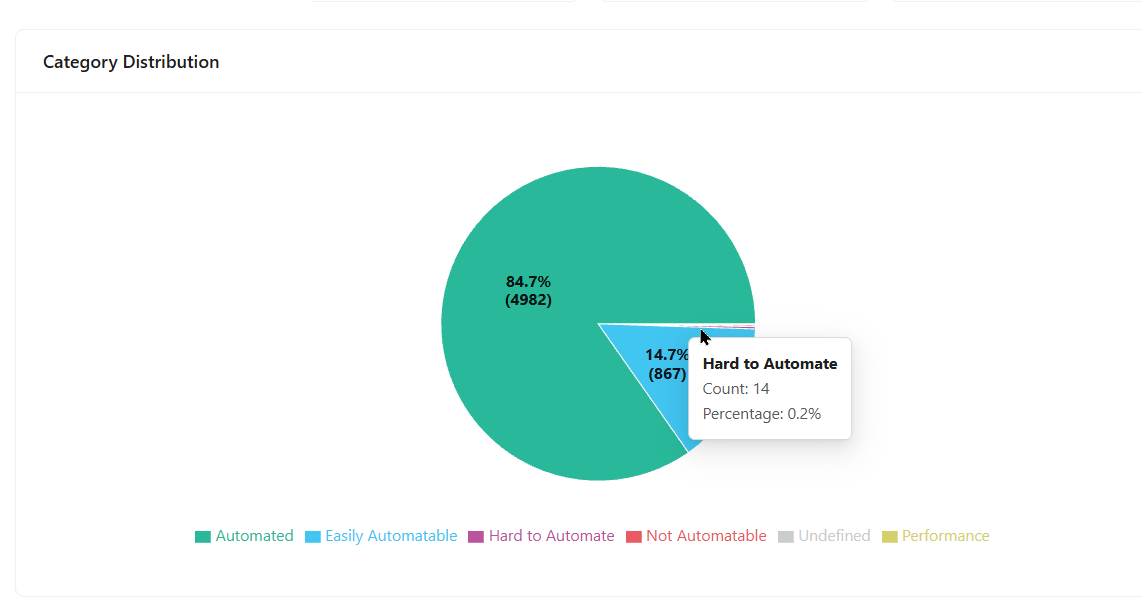
- The Category Distribution section uses a pie chart to show how all test cases within a specific team and project are distributed across defined categories.
- Each test case belongs to one of six categories: Automated, Easily Automatable, Hard to Automate, Not Automatable, Undefined, and Performance.
- The pie chart shows the percentage distribution of test cases across different categories.
- Automated test cases form the largest portion at 84.7%.
- Easily automatable test cases account for 14.7%.
- Other categories occupy very small portions but are displayed for completeness:
- Performance test cases: 0.1%
- Hard to Automate test cases: 0.2%
- This visualization helps users quickly understand how test cases are distributed across different automation categories.
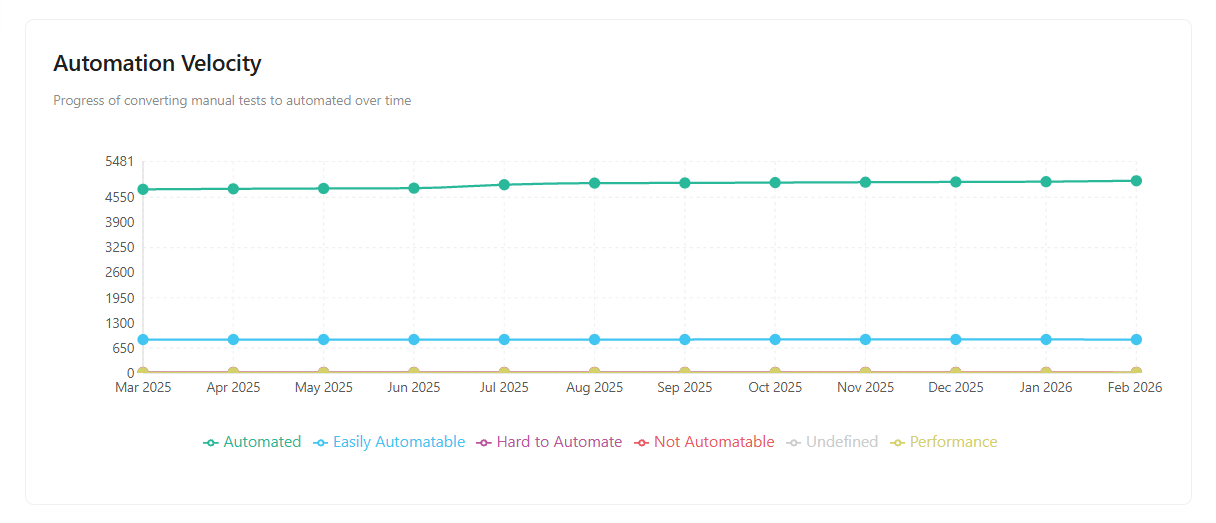
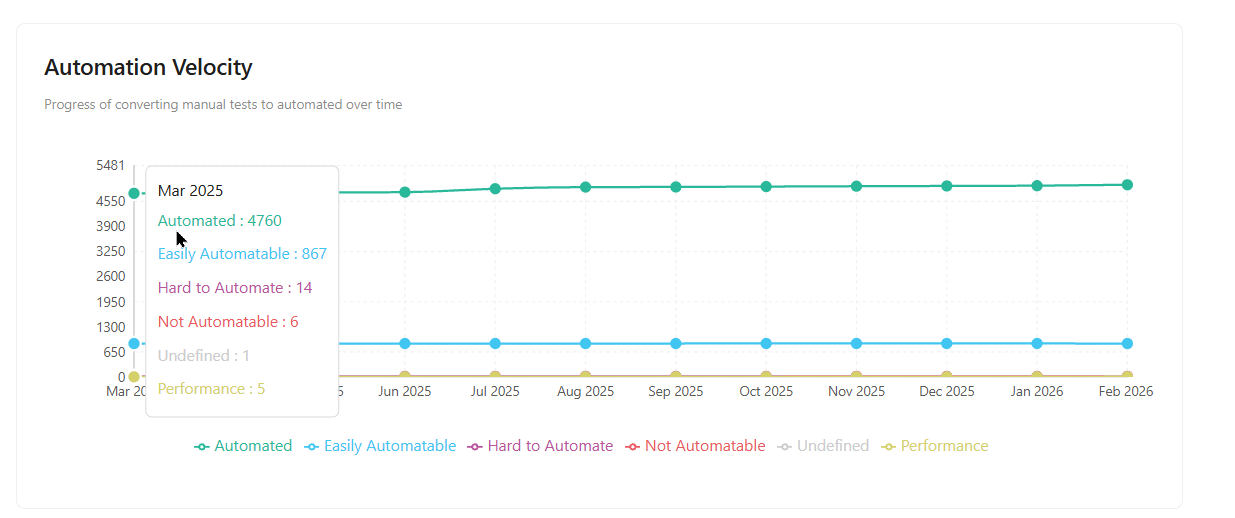
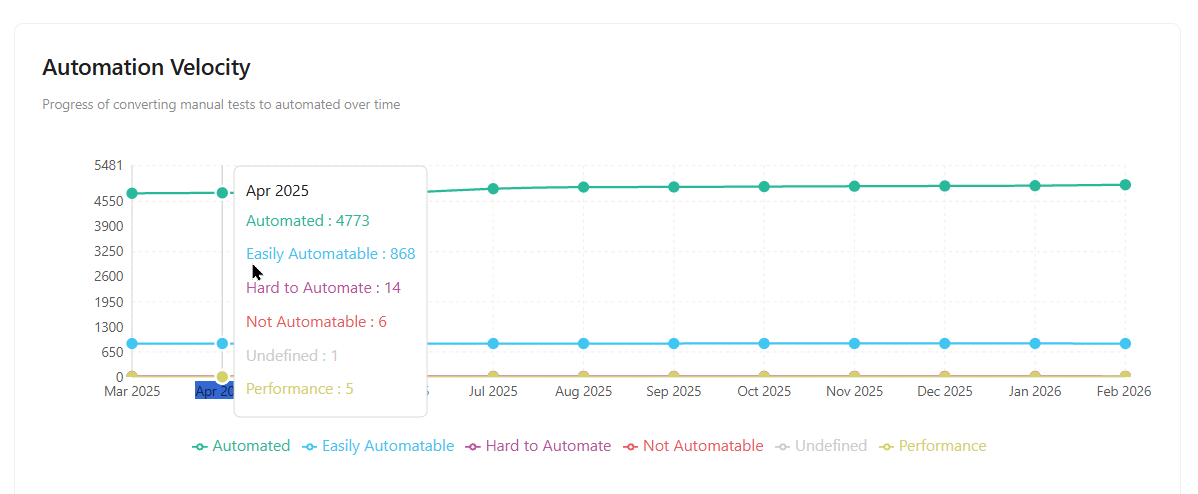
Automation velocity
- Automation Velocity shows whether the automation rate has increased or decreased over a period of time.
- By default, it displays a timeline covering the last 12 months from the current date. For example, it can show automation trends from
March 2025 to February 2026. - The chart shows the changes, by breaking down the entire timeline in 12-15 points.
- The chart compares all automation categories over time, showing how each category changes and progresses throughout the selected period.
Priority breakdown
- Displays the total number of test cases for each priority level (P1–P4) within a specific project and team, highlighting which priority has the most cases.
- Allows users to hover over a priority to view a detailed automation category breakdown.
- Shows how many test cases are automated, easily automatable, hard to automate, or fall into other categories.
- For example, among
3,712 P1 test cases, 3,633 may be automated, 72 easily automatable, and 2 hard to automate.
Automation breakdown
- Displays test case counts and their automation category distribution at the folder or feature level.
- Shows how automated, easily automatable, and other category test cases are spread within each folder or feature.
- Allows filtering of all data by folder, feature, or milestone for more focused and detailed analysis.
- Additionally, data can be filtered by folder or feature using the search bar.
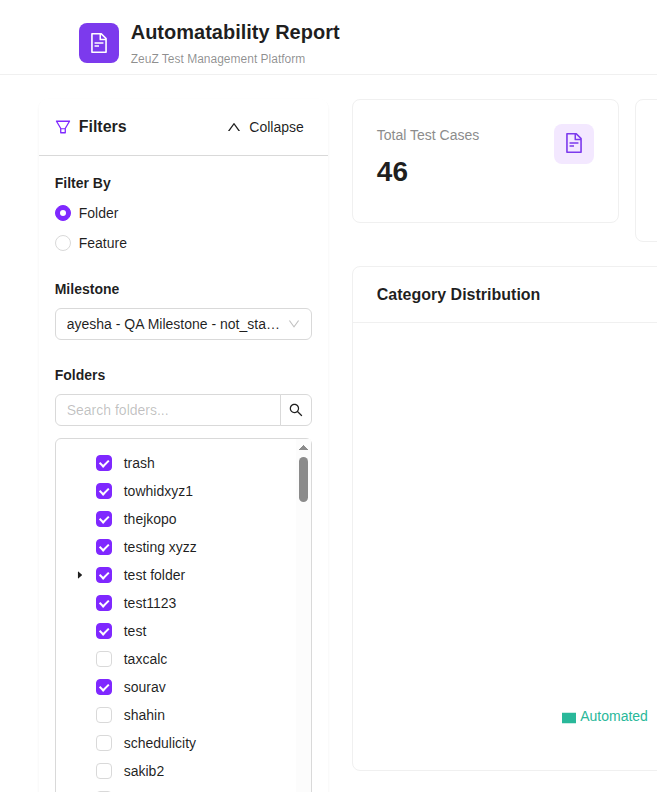
Filter option
- Users can select a specific test folder to view statistics related only to that folder. For example, if a folder contains 11 total test cases and has a 100.0% automation rate, all displayed metrics will reflect that folder’s data.
- Multiple folders can also be selected to view combined statistics, along with an optional milestone filter.
- When a milestone is selected, all data is displayed in the context of that specific milestone.
- Similarly, users can select individual features to review their corresponding automation statistics.
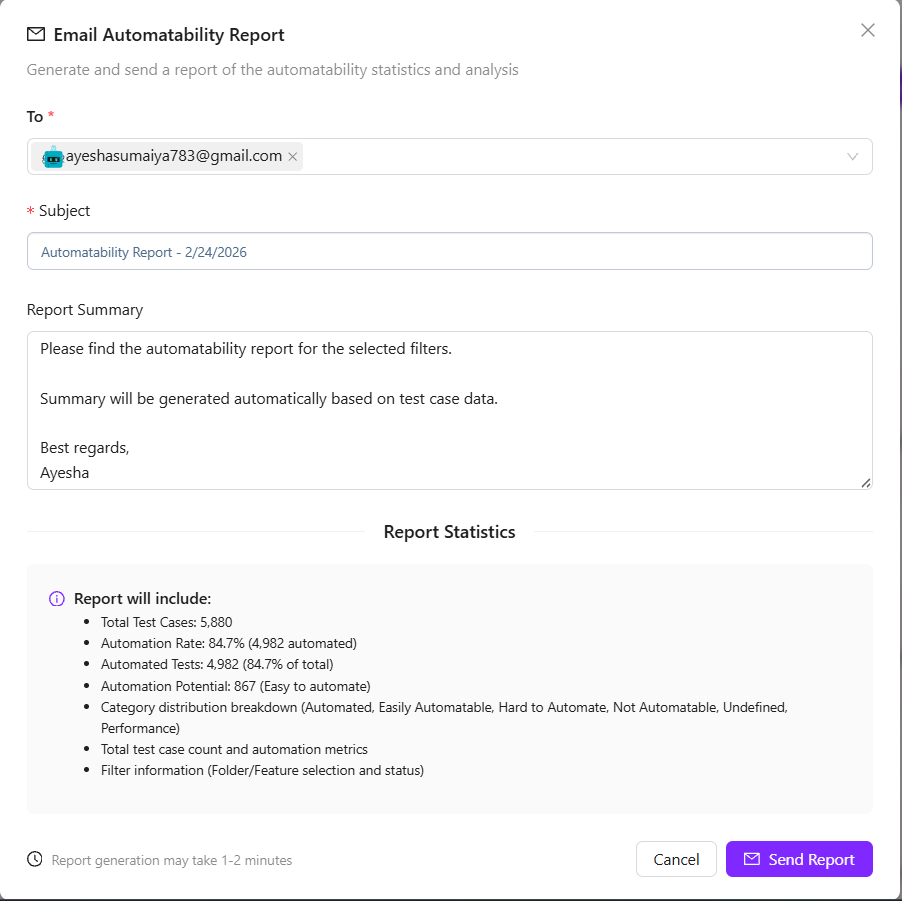
Email report
- Email Automatability Report is used to generate and send the automatability report via email.
- At the top, the user can enter one or more recipient email addresses in the To field.
- The Subject field is mandatory and is prefilled with a default report title that includes the report date.
- The Report Summary section allows the user to add a short message. The summary content is generated automatically based on the selected test case data, and a sign-off is included at the end.
- The Report Statistics section clearly lists what the emailed report will contain, including total test cases, automation rate, number of automated tests, automation potential, and category distribution across Automated, Easy to Automate, Hard to Automate, Not Automatable, Undefined, and Performance. It also confirms that folder or feature filter information will be included.
- A note at the bottom informs the user that report generation may take 1–2 minutes.
- Finally, the user can either cancel the action or click Send Report to email the automatability report.
Export report
- First, click the Export Report button.
- It captures the entire chart and generate as PDF report.
FAQs / Troubleshooting
Why do the statistics change after selecting a folder or feature?
All metrics are recalculated based on the selected folder or feature. Only test cases within the selection are included in the report.
Why is Automation Velocity empty or showing limited data?
This may happen if the selected milestone does not contain sufficient historical data or if automation activity has not occurred during that period.
Why is the report taking time to generate?
Report generation may take 1–2 minutes, especially for large projects with many test cases and multiple filters applied.
Changelog
- Automatability Report Redesign: New analytics dashboard with statistics cards, velocity and priority charts, email reports, PDF export, and advanced filtering. [202602]