Fail Analysis
Fail Analysis is the process of examining failed tasks or test cases to find the root cause, classify issues, and take corrective actions to prevent future failures.
Why it matters / Use Cases:
- Analyzing failed test cases to fix defects.
- Tracking recurring failures to spot patterns.
- Assisting in reporting and compliance by documenting failure reasons.
Prerequisites
- Access to ZeuZ Server with permissions for Testing → Reports → Fail Analysis.
- Test executions completed with failed cases available for review.
- Detailed test logs or reports generated from executions.
- Associated versions, or milestones linked to the test runs.
- Need to configure Github/Jira Integration from admin panel if you want to see Github/Jira tab.
Quick-Start
- Open the Fail Analysis page, and check the graph to compare failures across versions or milestones at the top.
- Review the failed test case cards and also add comments into it.
- Assign tickets to the team members (Use control + click and the plus symbol).
- Group the test cases in three ways: 1) Group by Fail, 2) Group by Set, 3) Group by Assignee.
Features
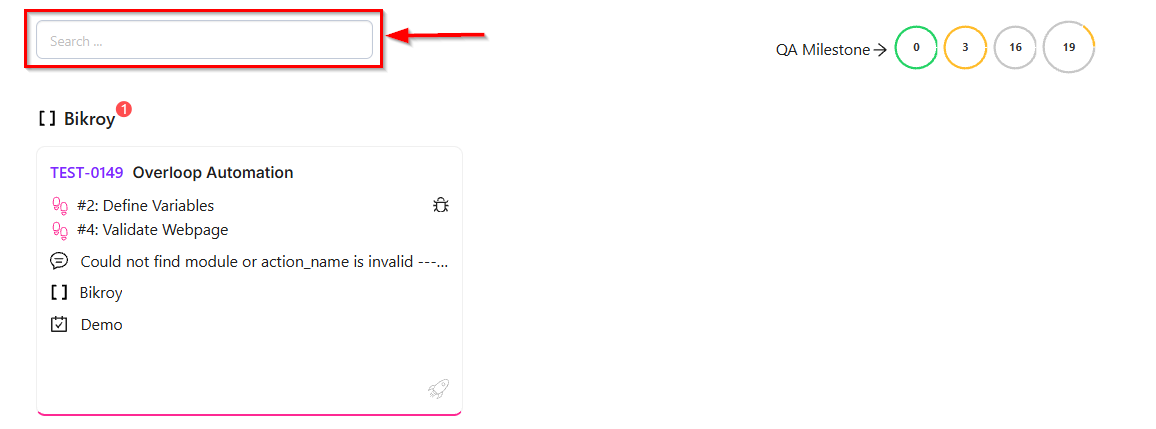
Search bar
- A search bar is available at the top of the page.
- It allows users to search for specific test cases directly.
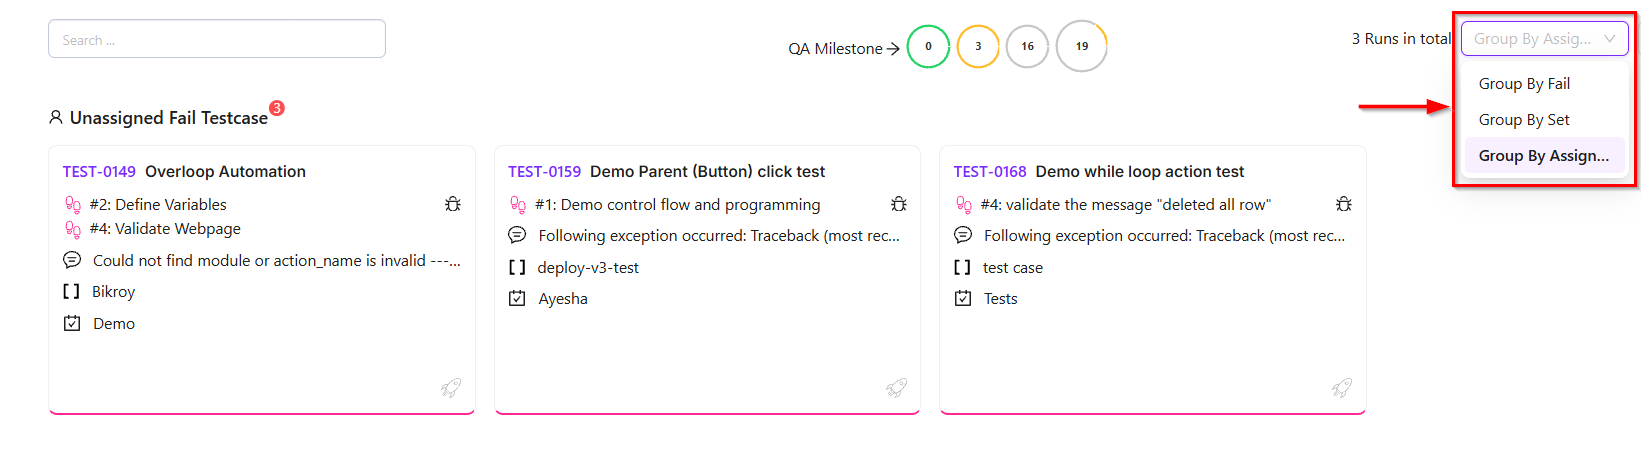
Grouping
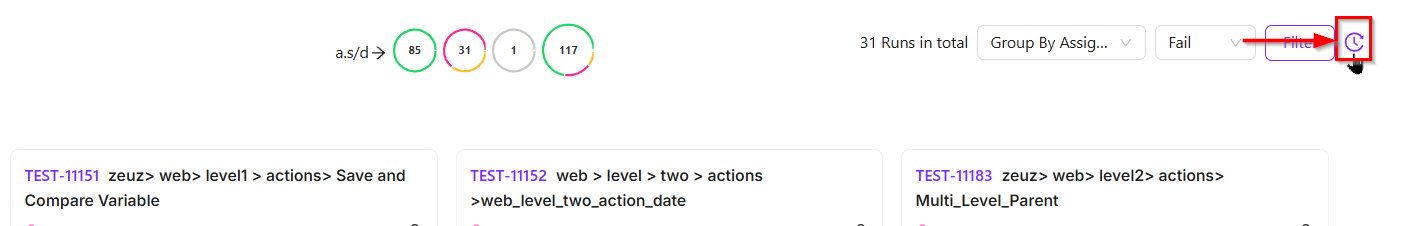
- The top bar shows how the data on the page is currently grouped.
- The current grouping is set to Group by Assignee.
- Users can change the grouping to Group by Set or Group by Fail.
- The selected grouping preference is saved automatically.
- After refreshing the page, the grouping remains unchanged.
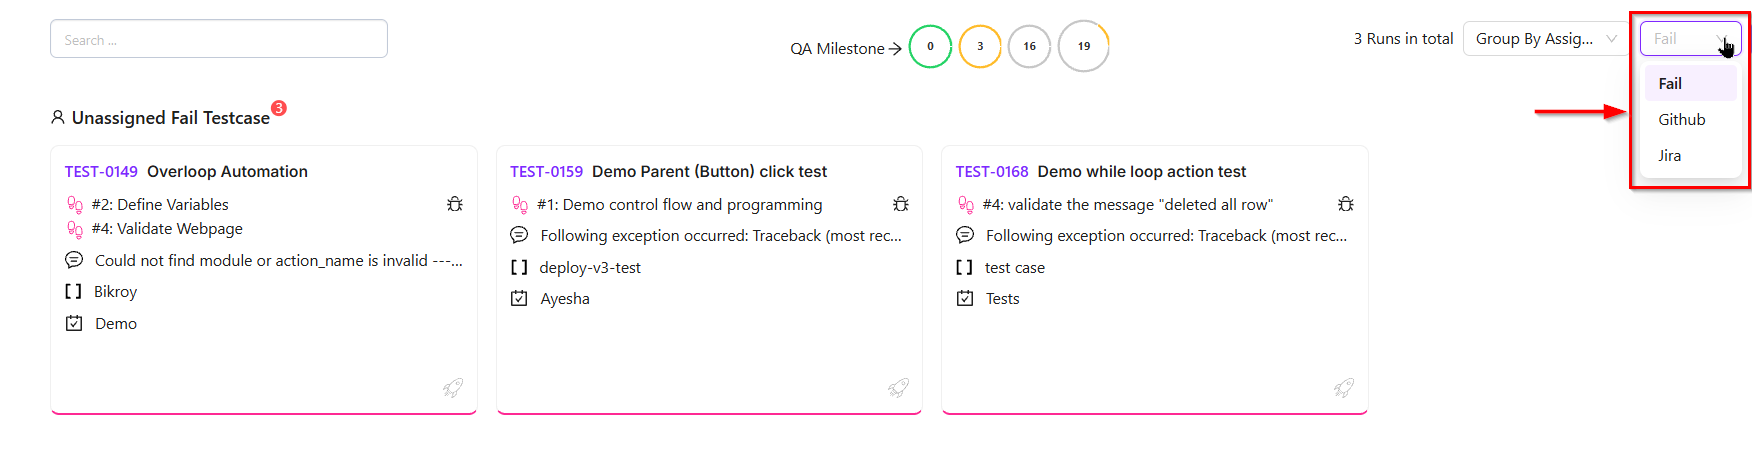
Tabs
- The dropdown is currently expanded, displaying available options.
- Fail tab is selected and highlighted, indicating the current choice.
- Additional tabs, GitHub and Jira, are available for selection, allowing the user to link or report the failure to an external system.
Filter
- First, click the Filter option.

- After clicking the "Filters" button, a "Customize your Filters" window appears with multiple tabs, including Milestone, Version, GitHub Issue, and Jira Issue.
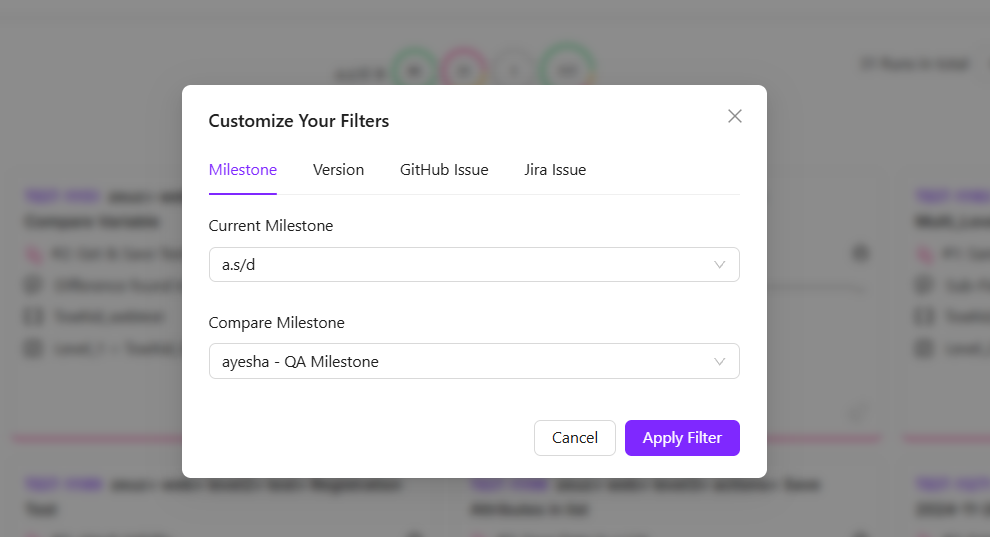
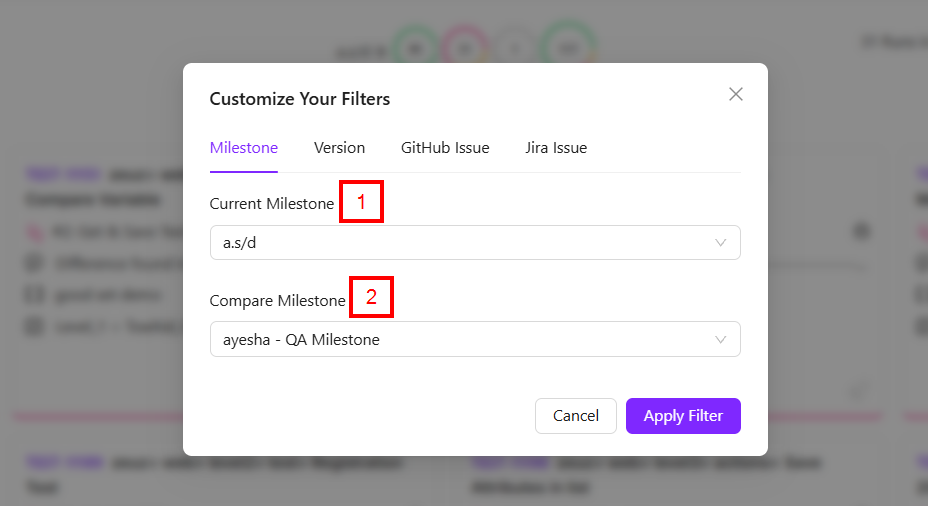
- To select a Milestone, click the
Milestonetab and fill in the required information and then click Apply Filters:- Current Milestone: It is the milestone whose data is currently shown and used to calculate all report metrics.
- Compare Milestone: It refers to another milestone selected for comparison against the current milestone.
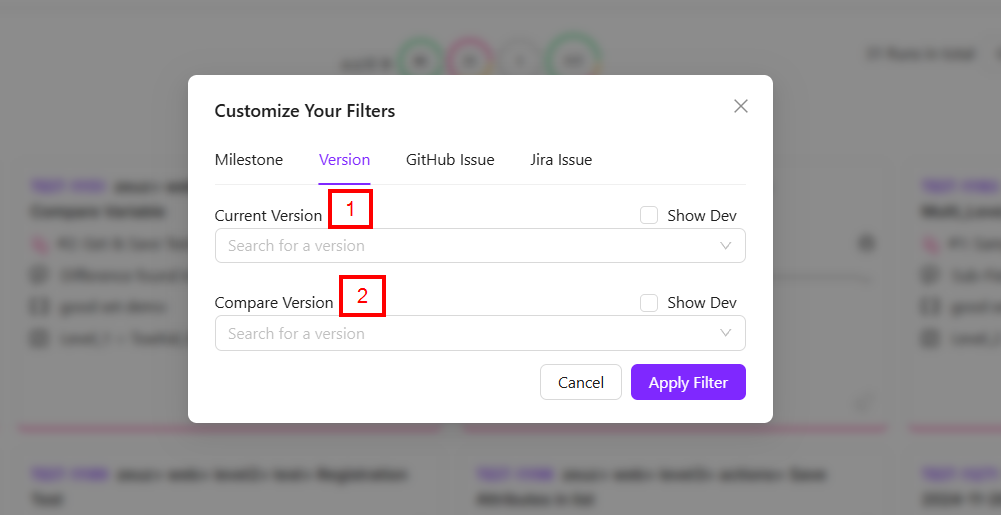
- To select a Version, click the
Versiontab and fill in the required information and then click Apply Filters:- Current Version: It refers to the software version whose test case and automation data is currently displayed in the report. All metrics are calculated based on this selected version.
- Compare Version: It is an additional software version selected to compare its metrics with the current version.
If we want to select a version, we can choose the production version by default, or select the development version by clicking the "Show Dev" checkbox.
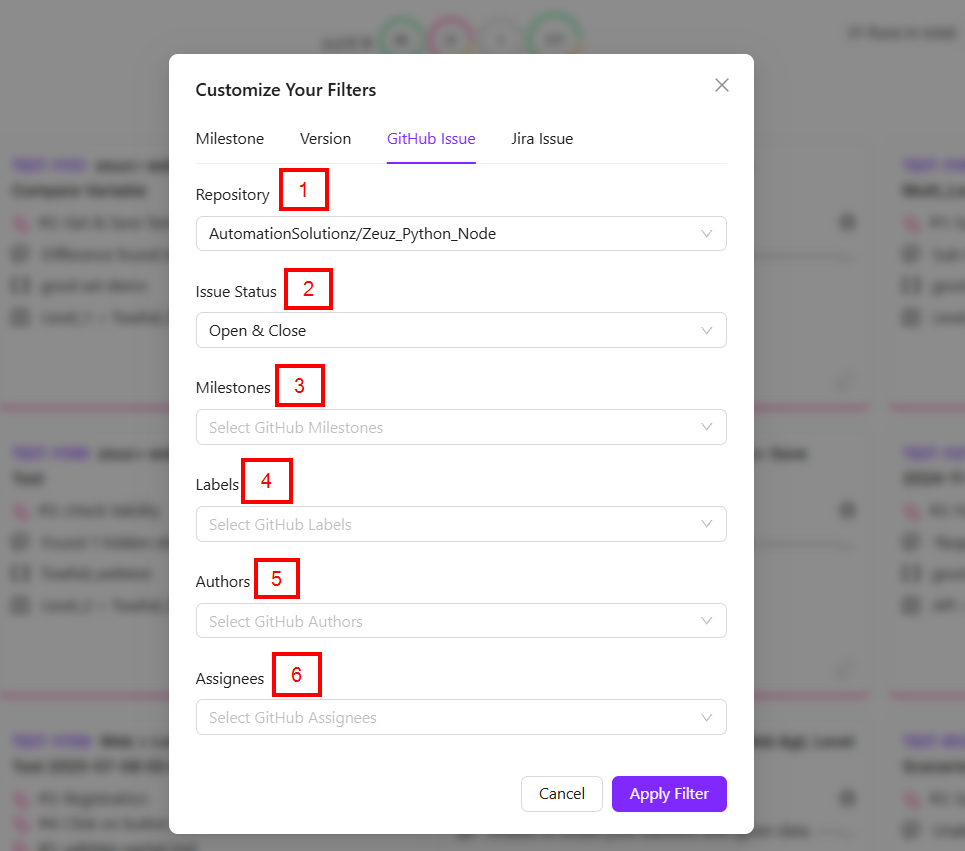
- To select a GitHub Issue, click the
GitHub Issuetab and fill in the required information and then click Apply Filters:- Repository: It allows users to select the GitHub repository from which issues will be considered.
- Issue Status: It enables filtering issues by status, such as open, closed, or both.
- Milestones: It allows selection of specific GitHub milestones to narrow down issues.
- Labels: It supports filtering issues by one or more labels, which are displayed as removable tags.
- Authors: This field filters issues created by selected users.
- Assignees: This field filters issues assigned to specific users.
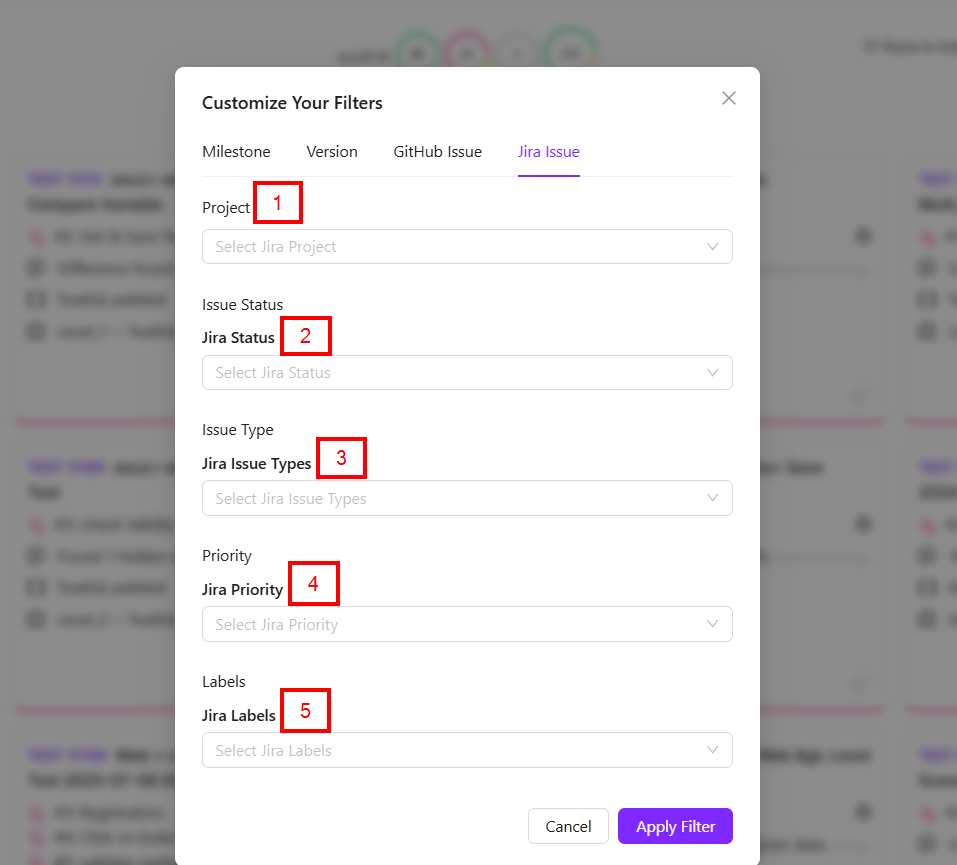
- To select a Jira Issue, click the
Jira Issuetab and fill in the required information and then click Apply Filters:- Project: It allows users to select a specific Jira project.
- Issue Status: It enables filtering by Jira status, such as the current workflow state of issues.
- Issue Type: It allows selection of specific Jira issue types.
- Priority: This field filters issues based on their assigned Jira priority.
- Labels: This field allows filtering issues using Jira labels.
At the top-right side of the page, to the right of the Filter button, there is another button that navigates to the History page when clicked.
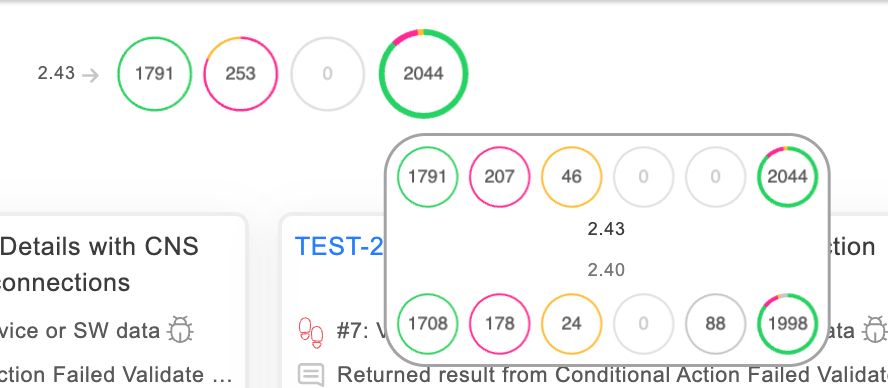
Comparison graph across milestones or versions
At the top of the page, a Comparison graph is displayed. When there is no data, the graph appears empty, but once data is available, it can compare results across two versions or milestones.
The graph shows how many test cases failed in the previous release versus the current release, and how many are passing in each. This provides a quick view of the stability of the current release compared to the previous one. Based on this analysis, teams can make informed decisions, for example: if the current release is less stable, the release may be delayed to fix bugs and rerun test cases to ensure stability.
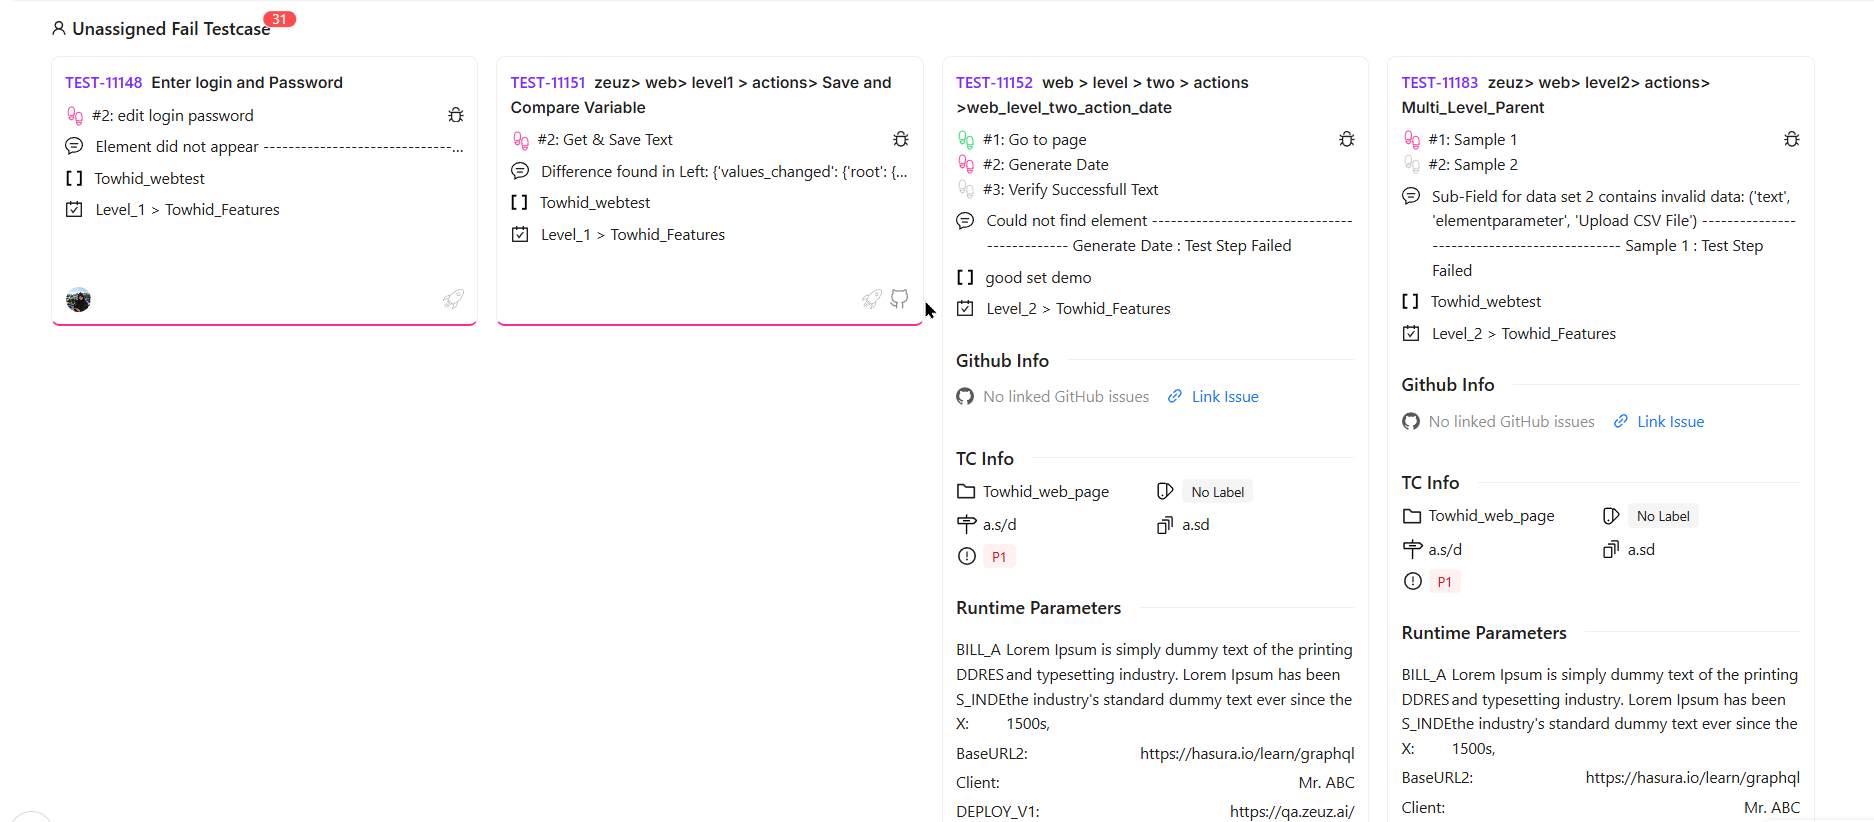
Card View in Fail Analysis
- Users can search test cases by name, feature, and other available attributes.
- When a search is applied, only the matching results are shown within the existing top-level groups.
- Each group header displays the group name and the number of failed cards in that group.
- A select icon is available on the right side of each group header, allowing users to select all cards within that group at once.
- Users can also manually select cards within a group.
- To select multiple specific cards, users can click the first card, then use Ctrl + Click to select individual additional cards.
- To select a range of cards, users can click the first card and then use Alt + Click on another card to select all cards between them.
- On the bottom-left of each card, a runtime icon indicates the test type, such as automated, manual, performance, or hybrid when multiple types are involved.
- If a GitHub issue is linked, the GitHub icon appears darker to indicate an active link.
- When a card is not expanded, it displays the first failure comment along with the set and feature information.
- When the card is expanded, all test case steps are shown and color-coded by status: passed steps appear in green, failed steps in red, and skipped steps in gray.
- Users can click on a comment to open the work slider, which displays details such as set, feature, and GitHub information.
- Hovering over the GitHub link provides an option to unlink the issue, which can be done with a single click.
- If no GitHub issue is linked, users can link one by clicking Link Issue, selecting a repository, searching for an issue, and confirming the link.
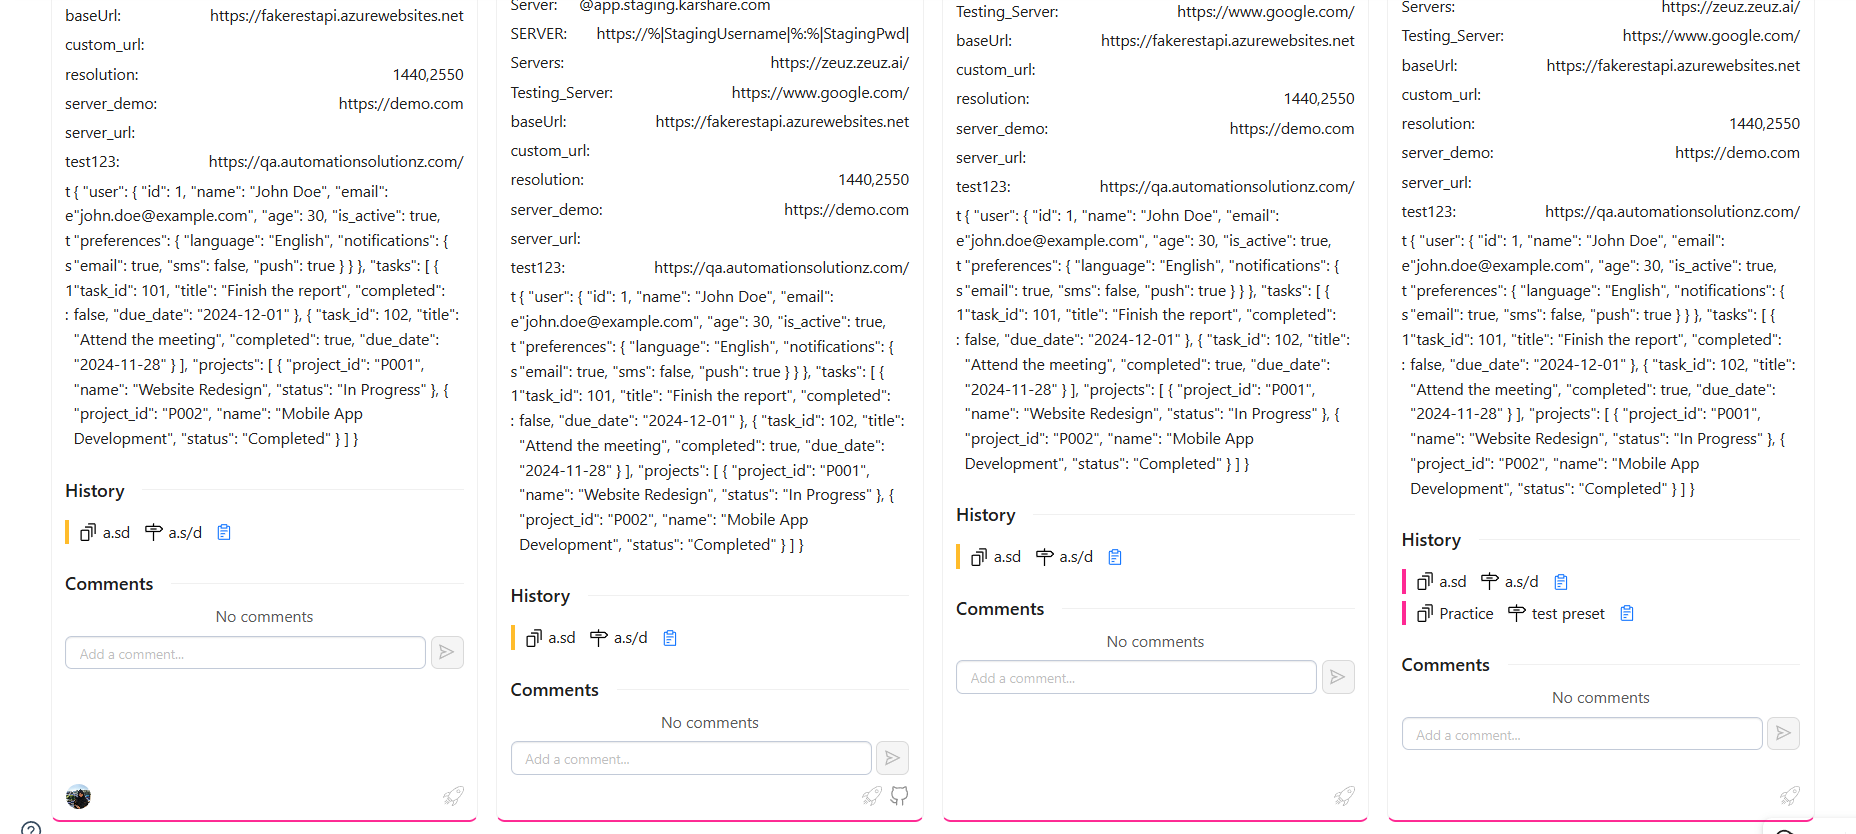
- When a card is selected, a sidebar opens showing detailed information, including linked GitHub details.
- The sidebar displays test case information followed by runtime parameters.
- Execution history is also visible in the sidebar. If there are more than four history entries, the section becomes scrollable.
- Users can navigate directly to the run details page by clicking the Run ID icon.
- Below the run details, existing comments are displayed, and new comments can be added.
- During linking or selection of a test case, a small assignment window appears.
- Users can assign a user from this window, and the assigned user’s profile is shown in the UI.
- The assigned user can be removed easily by clicking the Unassign button.
Snapview
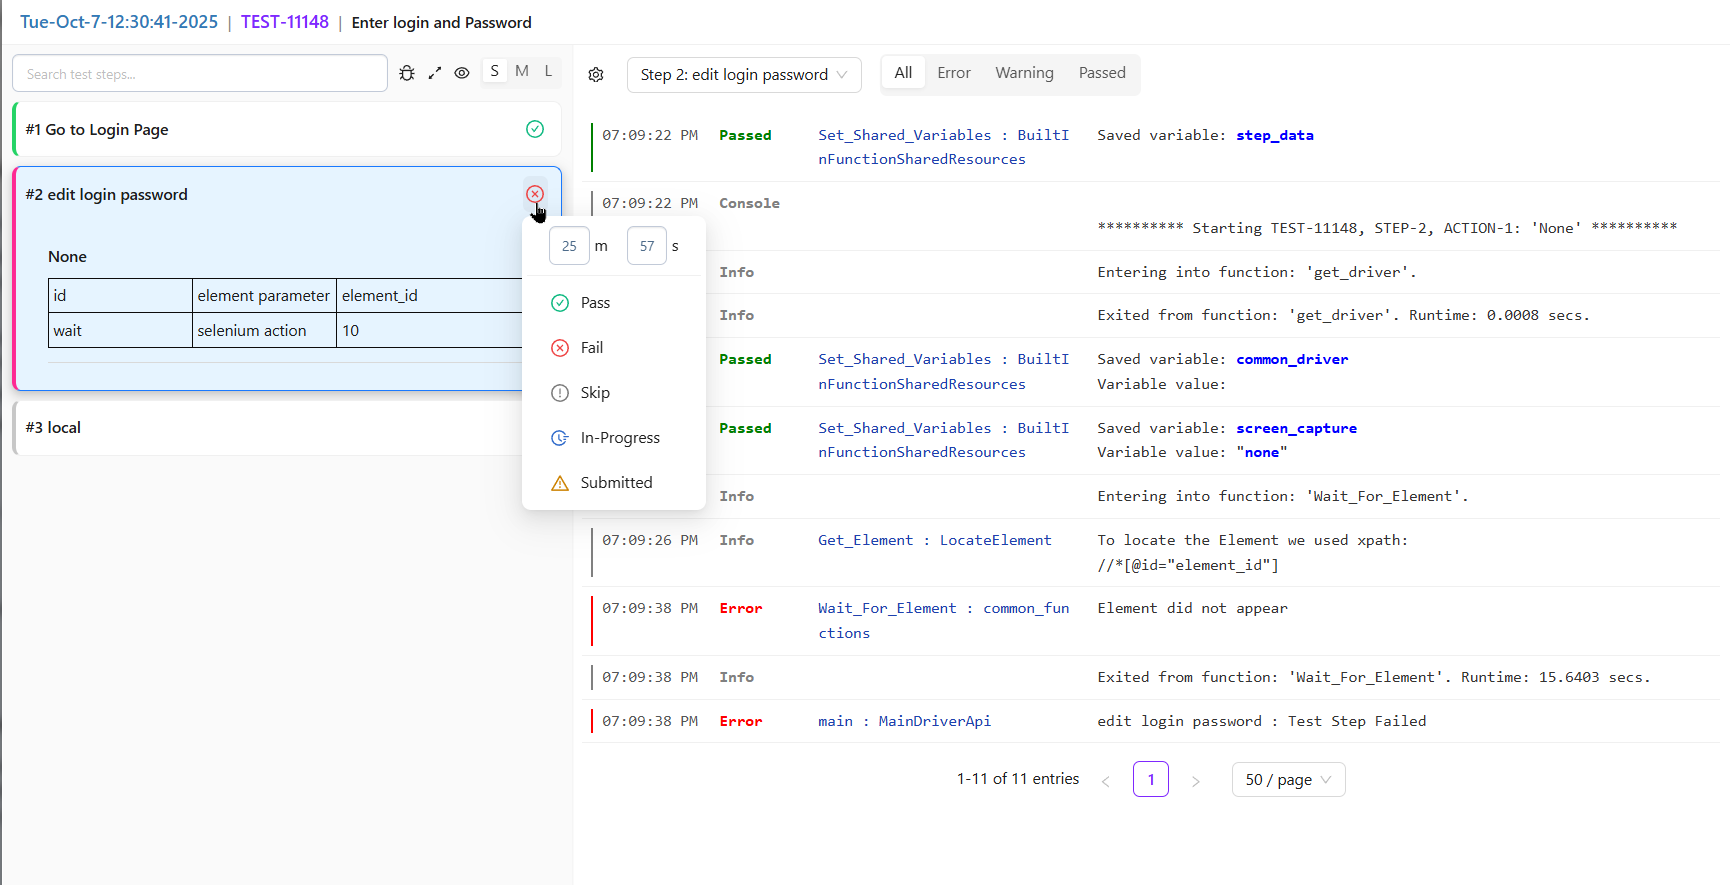
- Users can first filter logs by log type. For example, selecting Error displays only error-related logs.
- Pagination controls are available at the bottom, allowing users to navigate between pages, including moving to the first or last available page.
- Display settings allow users to choose which fields are visible, such as showing or hiding time, date, or module columns.
- These display preferences are saved in the database, so the same settings remain applied after refreshing the page.
- On the left side, test steps are listed with options to Expand All or Collapse All.
- Users can debug a test case by navigating back to the run view and expanding all steps.
- If screenshots are available, they are displayed clearly and can be previewed in a larger view when needed.
- Screenshot display size can be adjusted by selecting Small, Medium, or Large view options.
- The width of the steps panel can be increased by dragging to focus more on the left side.
- The module section can also be resized by dragging, and layout preferences are saved automatically.
- At the top, users can navigate directly to the Run ID or the test case and view the test case title.
- A search option allows filtering steps by step name.
- Users can hide actions that do not have screenshots by enabling the Hide actions without screenshots option.
- The status and execution time of test case steps can also be updated if needed.
FAQs / Troubleshooting
FAQs
What is Fail Analysis and why is it important?
Fail Analysis shows at which steps a test case is failing and explains the main reason for the failure. It is important because it helps identify the root cause of failures.
How can I view failed test cases and their details?
Failed test cases are shown in cards with failure step, folder, feature, and status.
Can I assign failed test cases to team members for investigation?
Yes, managers can assign tickets using Control + Click and the plus (+) symbol.
How do I compare failures across versions or milestones?
Use the comparison graph to see failures across selected versions or milestones.
Can Fail Analysis integrate with tools like GitHub for issue tracking?
Yes, GitHub issues can be viewed and filtered by status, milestones, or labels once integrated.
Troubleshooting
- Failed test cases not showing → Check permissions, project selection, and data availability.
- Unable to assign test cases → Ensure proper access and follow the correct assignment steps.
- Comparison graphs not displaying → Verify that data exists for the selected versions or milestones.
- Comments or updates not visible → Refresh the page or check if the user has commenting permissions.
Changelog
- Fail Analysis Page Redesign: Modern UI with multi-card selection, full step visibility, runtime parameters, saved preferences, and quick unassignment [202602]