Worklog
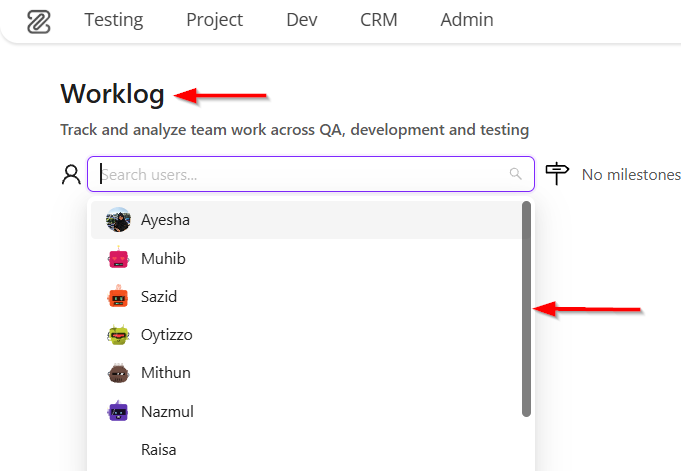
The Worklog Summary provides an overview of worklog entries, enabling users to filter and search by user,
milestone, and date range. Quick filters such as YESTERDAY, TODAY, TOMORROW, 7 DAYS, +1 YEAR, and
CUSTOM simplify selection, while the SEARCH button applies filters and the Everything button displays
all entries. The interface distinguishes between time spent and planned/estimated time, presenting data both numerically and visually through a pie chart for clear insights.
Why it matters / Use Cases:
- Effort Comparison and Workload Analysis: It compares spent time and estimated time side by side, helping teams identify overloading or underutilization of effort.
- Visual Effort Distribution by Work Type: Visual pie charts break down time by work type (such as documentation and meetings), making effort distribution easy to understand at a glance.
- Overload Detection and Capacity Management: The overload indicator highlights when planned work exceeds available capacity, supporting early corrective action.
- Targeted Performance Review Using Filters: Filters by user, milestone, and date range help managers review performance for a specific period or individual.
Prerequisites
- Access to ZeuZ Server with permissions for Project → Reports → Worklog.
- Work items must exist (such as tasks, test cases, bugs, or runs) to log time against actual work.
- Estimated or planned hours must be set, enabling meaningful comparison with spent time.
- Worklog entries must be logged consistently by users to generate meaningful summaries and visual reports.
Quick-Start
- Select a user from the Select User dropdown to view individual worklog entries.
- Use quick date options such as
YESTERDAY,TODAY,TOMORROW, or7 DAYSto instantly filter worklogs by time. - Click
SEARCHto apply the selected filters and view results.
Features
Create a worklog entry for the selected user
- Navigate to the Worklog Summary page.
- When using it for the first time, no User will be selected, so click to choose a User.
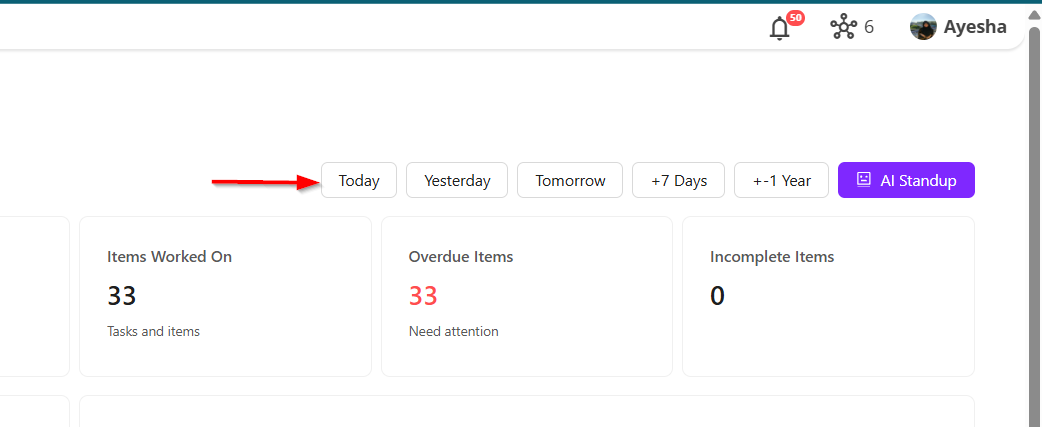
- Quickly filter worklog data using predefined date options such as Today, Yesterday, Tomorrow, +7 Days, +-1 Year, or AI Standup range.
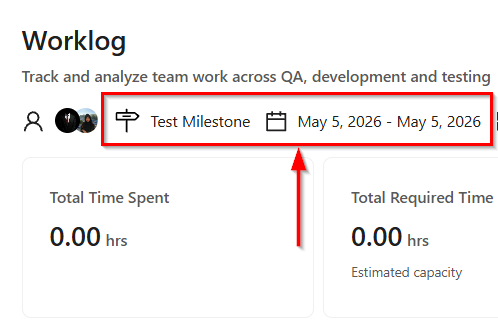
- The worklog can also be accessed by selecting a Milestone and a Date range.However, if Date Filtered is selected, it allows users to focus on Tasks, Bugs, and Test Cases that occured within the selected date range.
- Additionally, the Type of work and the Status can also be selected when creating a worklog in ZeuZ.

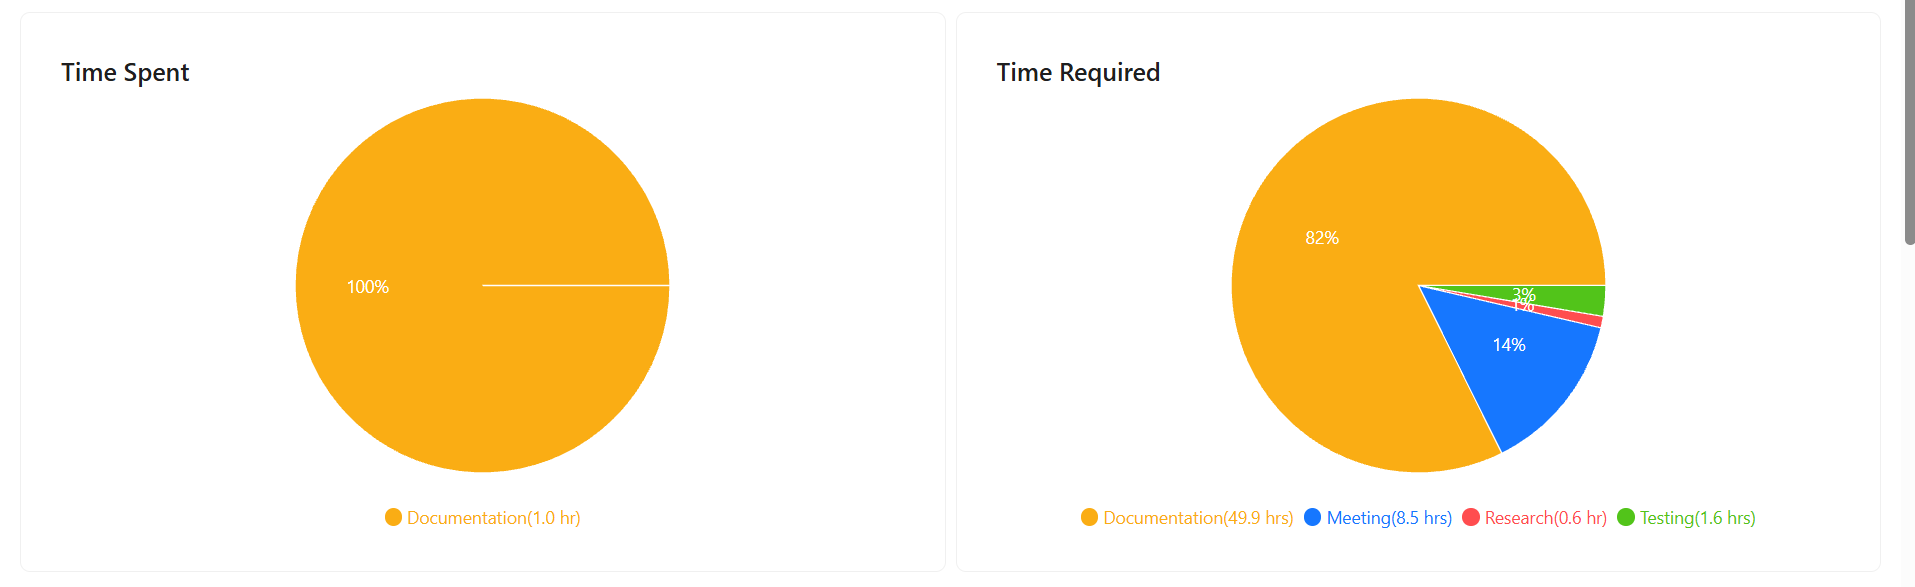
Visual pie charts
- The interface displays visual pie charts to represent data clearly.
- The left pie chart represents spent time, broken down by work types such as development, meetings, documentation, research, and testing, along with total hours spent.
- The right pie chart represents Time Required, showing planned effort distribution across selected work types and total estimated hours.
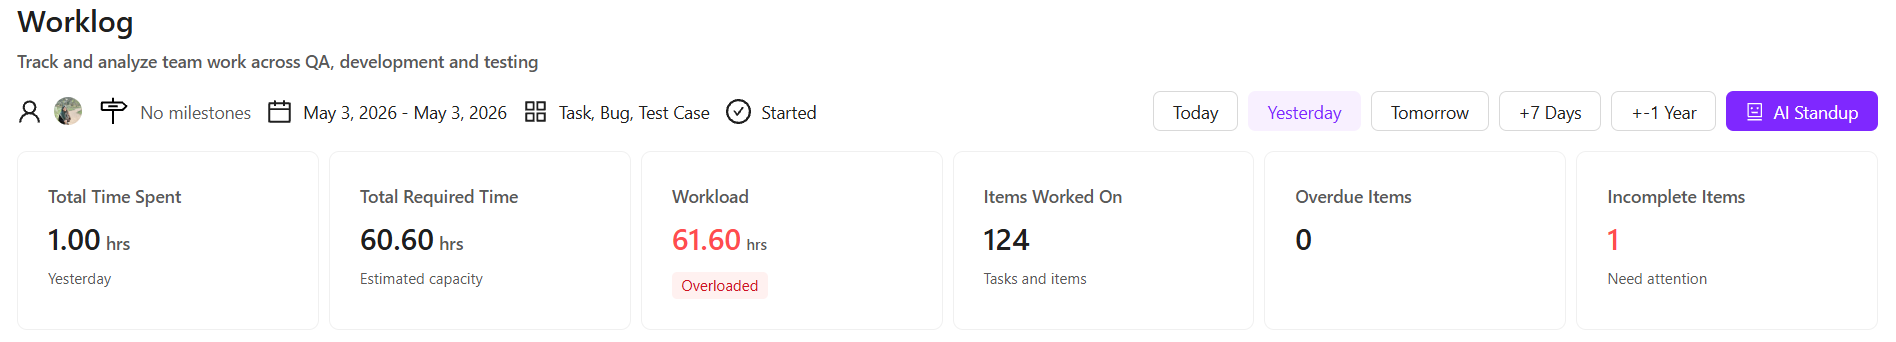
- However, the following information is displayed at the top:
- Total Time Spent: It refers to the actual amount of time that has been logged by users while working on tasks or items
- Total Required Time: It refers to the total estimated effort needed to complete all tasks or items. In simple terms, it shows how much time is planned to finish the work, based on task estimates.
- Workload: Workload refers to the total amount of work assigned to a user or team, usually measured in hours.
- Items Worked On: It represents the total number of tasks or work items to which a user has actively contributed in ZeuZ.
- Overdue Items: It refer to tasks or work items that have passed their assigned due date but are not yet completed.
- Incomplete Items: It refer to work tasks, test cases, or deliverables that have been started but have not yet been fully finished or marked as completed.
FAQs / Troubleshooting
Why is no data displayed in the Worklog Summary?
This usually occurs when no user, milestone, or date range is selected, or when no worklogs have been logged for the chosen period.
Why does spent time show zero hours?
Spent time appears as zero when the selected user has not logged any work entries for the selected date range.
Why does estimated time not appear or look incorrect?
Estimated time is shown only when planned or estimated hours are defined for tasks or work items.
What happens when the estimated work exceeds a user’s availability for a specific time period?
When the estimated work is more than a user’s availability for a specific time period, the system indicates an overload.
Why are pie charts not visible?
Pie charts are displayed only when worklog data exists. If no worklogs are available, the charts may not appear.
Changelog
- New UI has been introduced [20250518]
Related Topics
Since worklogs can be created for tasks, bugs, documents, test cases, and run history, the following links explain how to create tasks, bugs, documents, and test cases, and how to use the Run History page.
Tasks: https://docs.zeuz.ai/docs/zeuz-server/Project/Ticket/create-tasks/
Bugs: https://docs.zeuz.ai/docs/zeuz-server/Project/Ticket/create-bugs/
Documents: https://docs.zeuz.ai/docs/zeuz-server/Project/Ticket/create-documents/
Test Cases: https://docs.zeuz.ai/docs/zeuz-server/testing/Test%20Case/create-test-cases/
Run History: https://docs.zeuz.ai/docs/zeuz-server/testing/Deployments/history-page/